Fig. 16
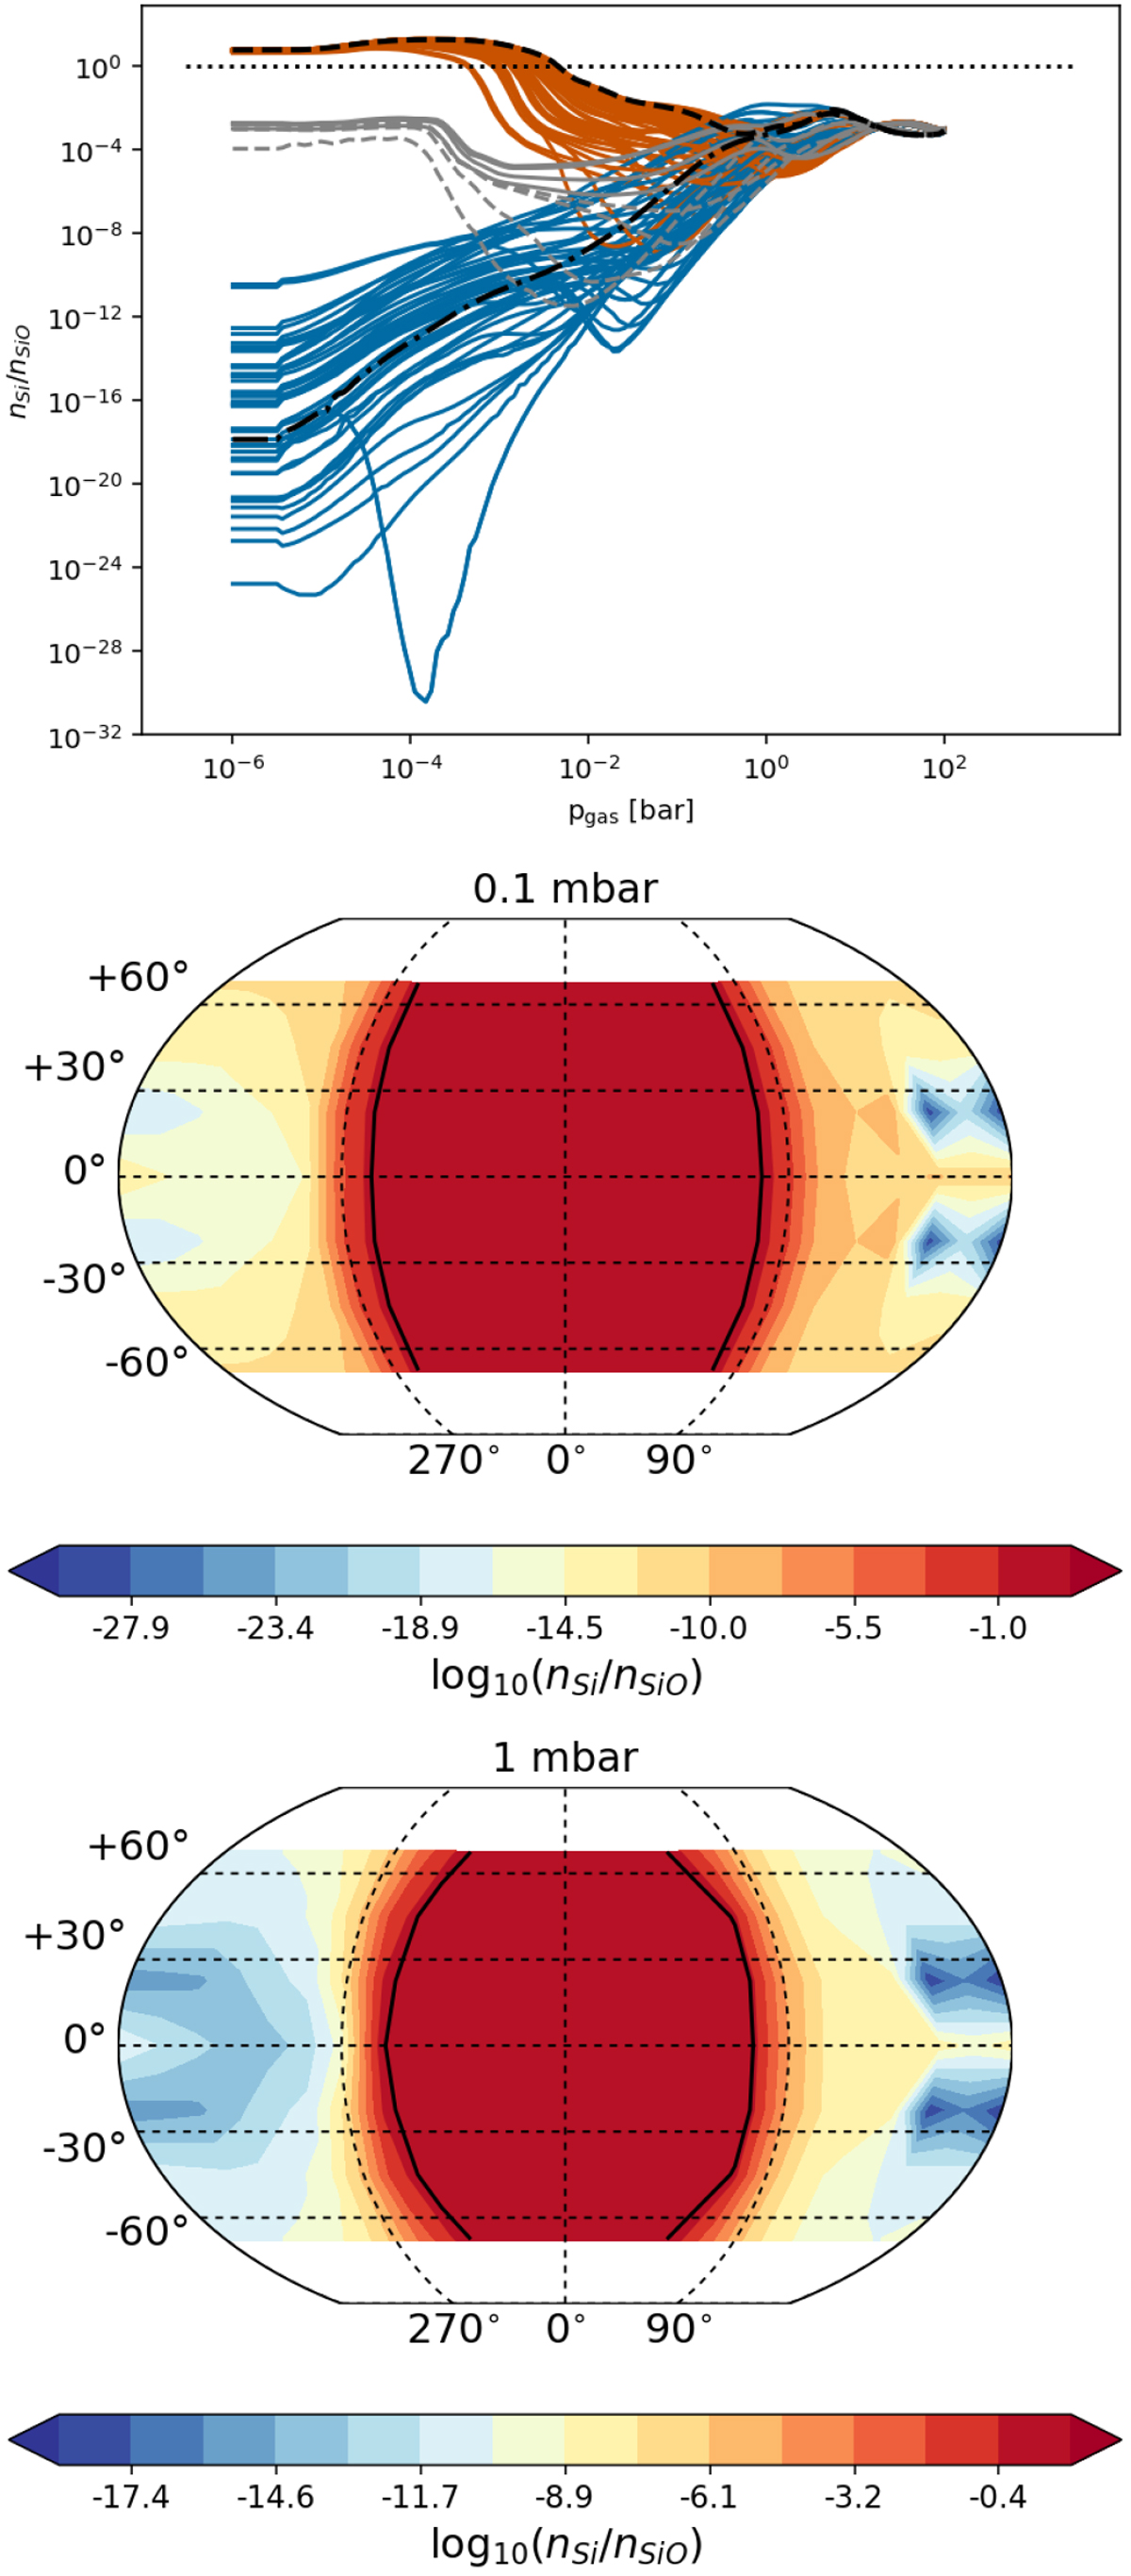
Atom/molecule ratio n(Si)/n(SiO). The figure follows the same structure and colour code like Fig. 12. The solid black lines indicates where n(Si) = n(SiO) which is off-set from where n(SiO) = n(SiO2). Similar to Fig. 15, The 1D profile (top panel) peaking at 10−3.8 bar is the one with the lowest temperature in our sample on the nightside.
Current usage metrics show cumulative count of Article Views (full-text article views including HTML views, PDF and ePub downloads, according to the available data) and Abstracts Views on Vision4Press platform.
Data correspond to usage on the plateform after 2015. The current usage metrics is available 48-96 hours after online publication and is updated daily on week days.
Initial download of the metrics may take a while.