Fig. 12
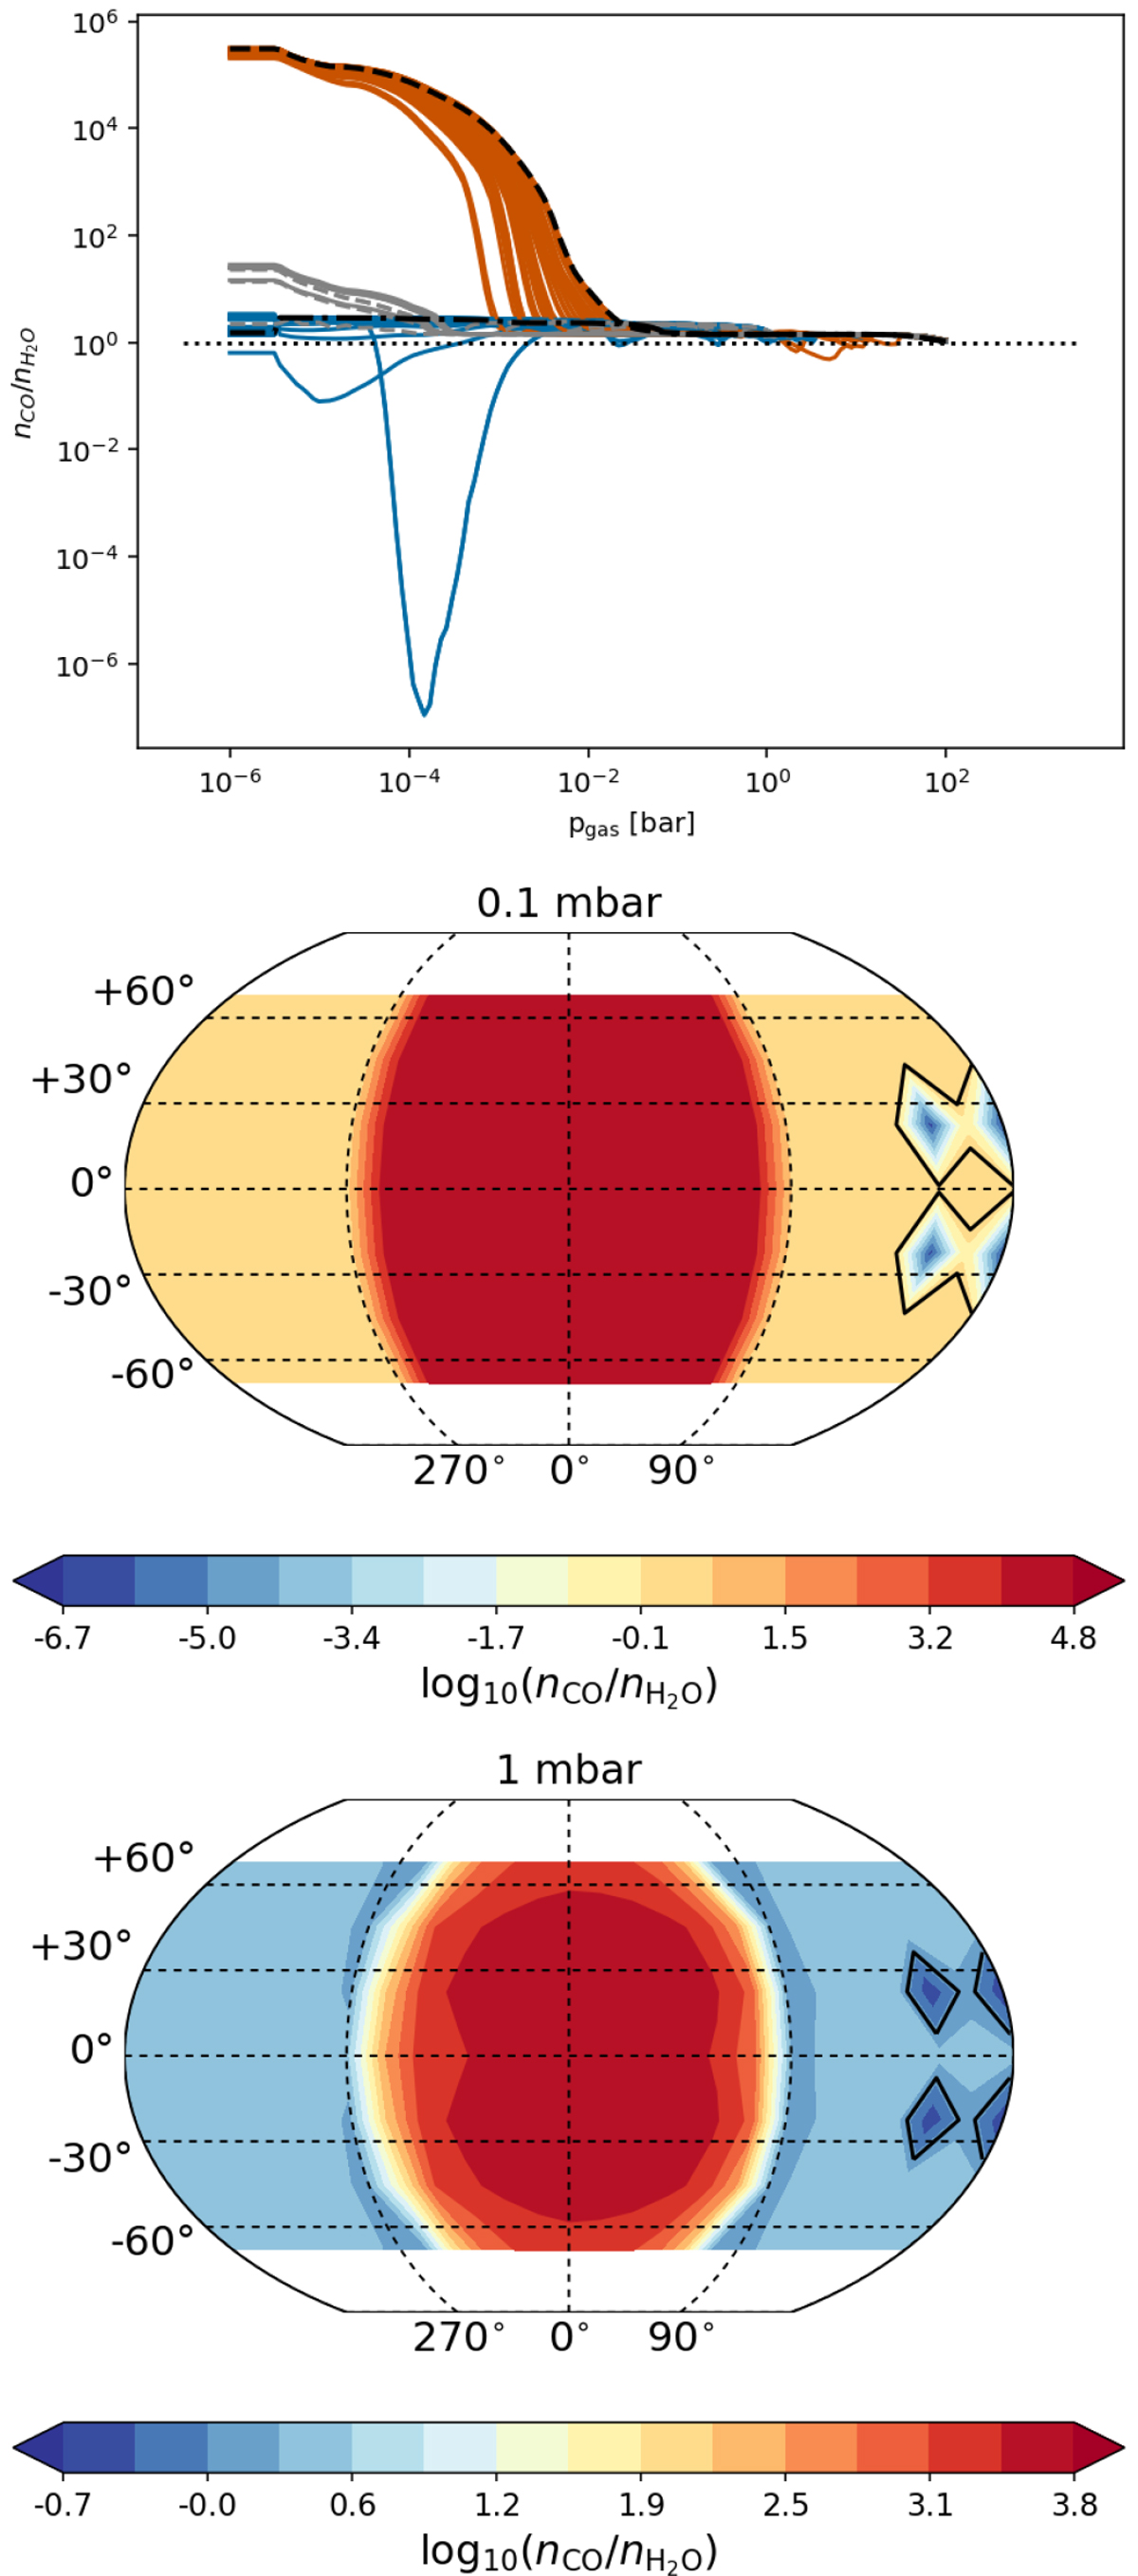
Molecular ratio n(CO)/n(H2O). Top: 1D structures of the n(CO)/n(H2O) distribution on HAT-P-7b. We follow the same colour code like in Fig. 3: blue – nightside, orange – dayside; day-night terminator: light blue and light orange, black-dashed: sub-stellar and anti-stellar points. Middle: global n(CO)/n(H2O) map at pgas = 10−3 bar representing the possibly optically thin part of the atmosphere. Bottom: global n(CO)/n(H2O) map at pgas = 10−2bar showing the transitional region from warm to cold (Fig. 3). The black contour lines in the 2D maps show where n(CO) = n(H2O). As seen in 1D plot (top) for pgas >10 mbar, only 2 profiles have n(CO) < n(H2O) on the “far” nightside.
Current usage metrics show cumulative count of Article Views (full-text article views including HTML views, PDF and ePub downloads, according to the available data) and Abstracts Views on Vision4Press platform.
Data correspond to usage on the plateform after 2015. The current usage metrics is available 48-96 hours after online publication and is updated daily on week days.
Initial download of the metrics may take a while.