Fig. 11
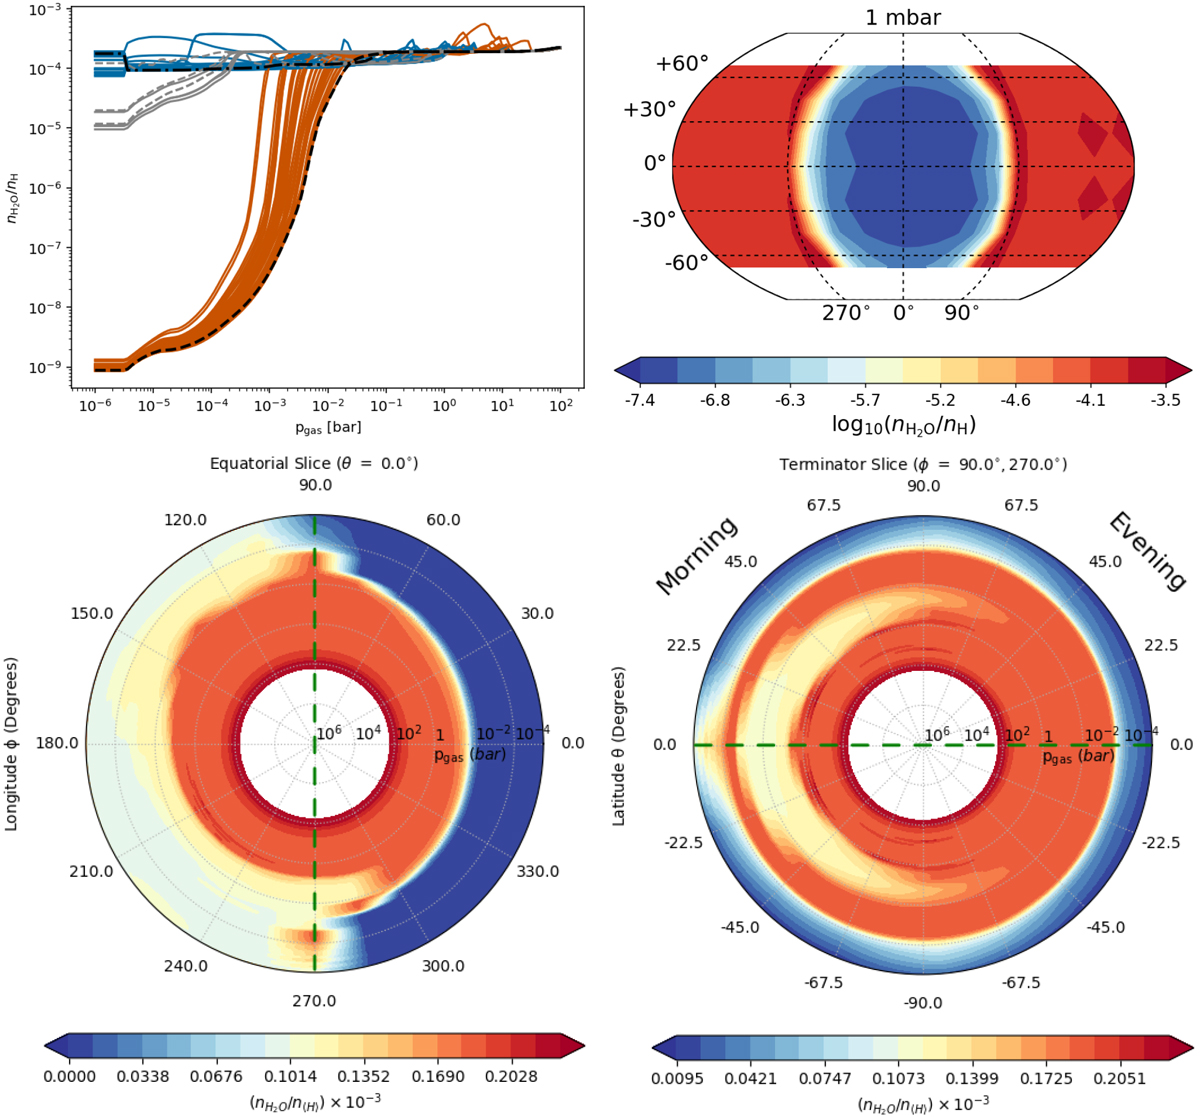
Gas-phase concentrations q(x) = nH2O∕n<H> (with nx (cm−3)), also called mixing ratio. Top left: 1D structures of the H2O distribution on HAT-P-7b. We follow the same colour code like in Fig. 3: blue – nightside, orange – dayside; light blue – morning terminator (ϕ = 270°), light orange – evening terminator (ϕ = 90°), black-dashed – substellar point (ϕ = 0°), black-dot-dashed – anti-stellar point (ϕ = 180°). Top right: global H2O map at pgas = 10−3 bar. Bottom left:2D cut through the equatorial plane. Bottom right: 2D cut along the terminator. The dashed green lines indicate where these two slice plots overlap. For the viewing geometry of the slice plots in the bottom row, please see Fig. A.2.
Current usage metrics show cumulative count of Article Views (full-text article views including HTML views, PDF and ePub downloads, according to the available data) and Abstracts Views on Vision4Press platform.
Data correspond to usage on the plateform after 2015. The current usage metrics is available 48-96 hours after online publication and is updated daily on week days.
Initial download of the metrics may take a while.