Fig. C.1.
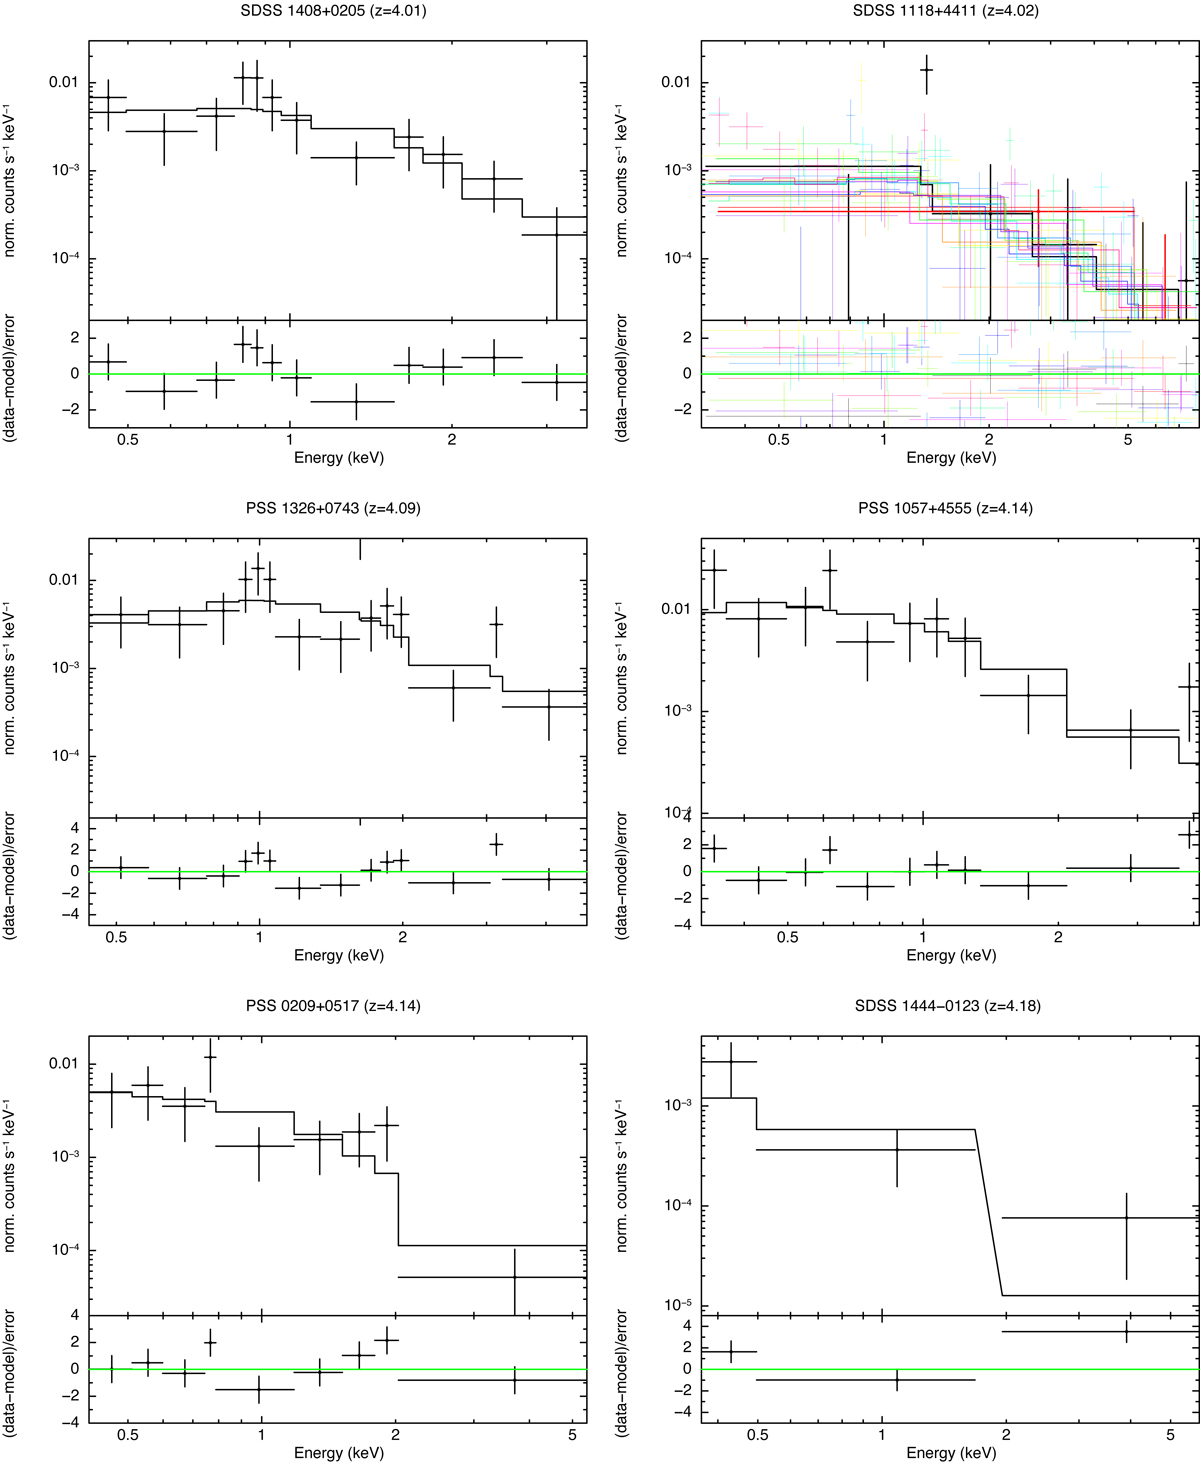
Best-fit models and data for 41 sources are presented in the top panels. Single epoch Chandra data are represented with black crossed points, while the best-fit model is indicated by a black line. In case of multiple Chandra data, we chose the more representative observation (e.g. the longest, or the observation for which we have the best-fit model with the lowest ![]() ). In case of single epoch XMM-Newton data, EPIC-pn data are indicated in black and merged EPIC-MOS in red. Multiple XMM-Newton observations have EPIC-pn and merged EPIC-MOS in various colours.
). In case of single epoch XMM-Newton data, EPIC-pn data are indicated in black and merged EPIC-MOS in red. Multiple XMM-Newton observations have EPIC-pn and merged EPIC-MOS in various colours.
Current usage metrics show cumulative count of Article Views (full-text article views including HTML views, PDF and ePub downloads, according to the available data) and Abstracts Views on Vision4Press platform.
Data correspond to usage on the plateform after 2015. The current usage metrics is available 48-96 hours after online publication and is updated daily on week days.
Initial download of the metrics may take a while.