Fig. B.1.
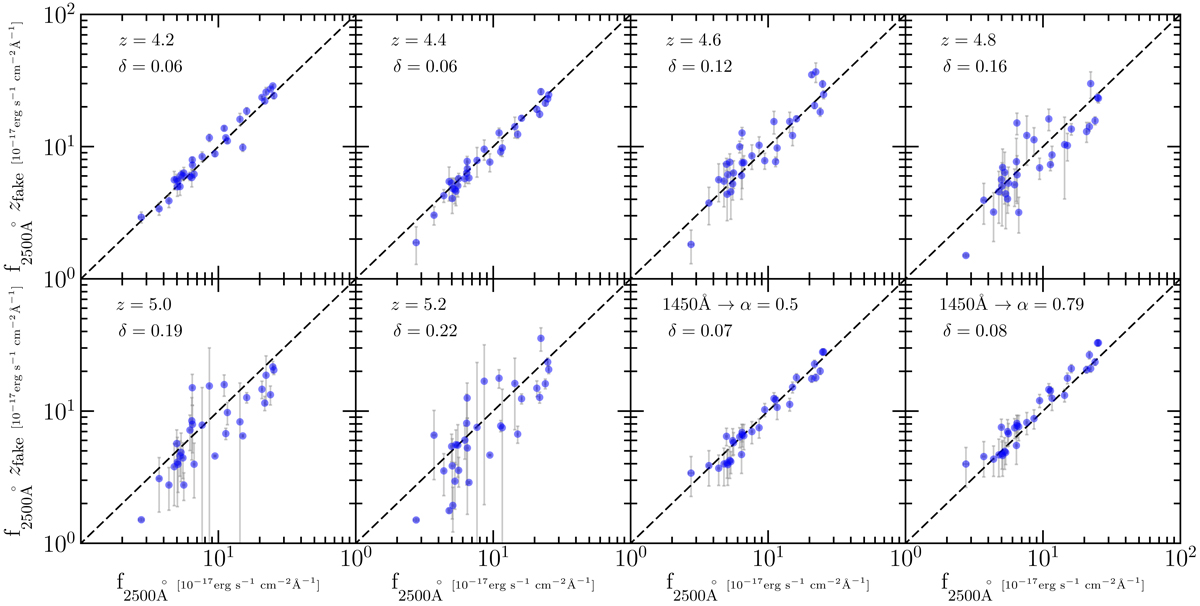
Results of the simulations used to choose between different procedures to estimate the 2500 Å flux densities on 30 luminous quasars at z ≃ 2. We compared the flux density observed values with those obtained with each of the three methods described in the appendix. From the top left panel: rest-frame 2500 Å flux estimated assuming redshift 4.2, 4.4, 4.6, 4.8, 5.0, 5.2 (y-axis) vs. that estimated from the full spectrum (x-axis). The last two panels represent the comparison between the true rest-frame 2500 Å flux from the spectra, and that estimated from an extrapolation with a fixed power law, having the slope equal to 0.5 (Vanden Berk et al. 2001) and 0.79 (Vignali et al. 2001), respectively. The normalisation is assumed to be in the 1430−1470 Å spectral range.
Current usage metrics show cumulative count of Article Views (full-text article views including HTML views, PDF and ePub downloads, according to the available data) and Abstracts Views on Vision4Press platform.
Data correspond to usage on the plateform after 2015. The current usage metrics is available 48-96 hours after online publication and is updated daily on week days.
Initial download of the metrics may take a while.