Fig. 3.
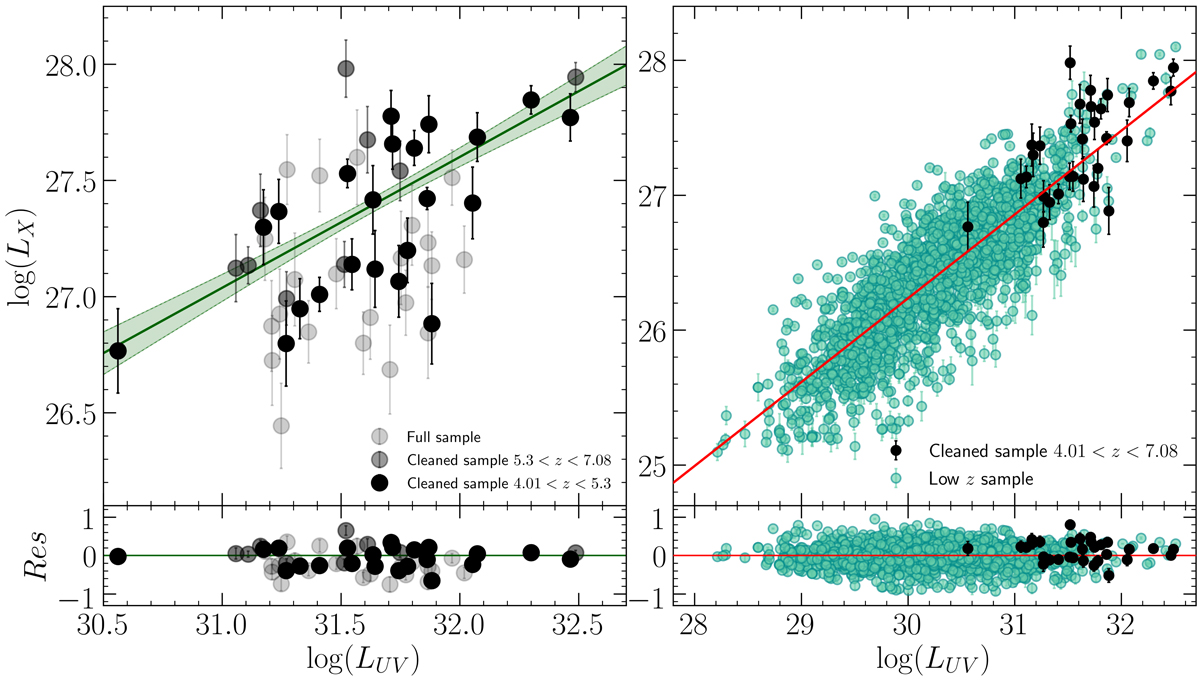
Left panel: log(LX) vs. log(LUV) plot for the high-redshift quasars sample (z > 4), where LX and LUV are the monochromatic luminosities at rest-frame 2 keV and 2500 Å in units of in erg s−1 Hz−1, respectively. Full black circles indicate the quasars (22 sources) of the cleaned sample with z < 5.3, dark grey circles represent those (9) of the cleaned sample with 5.3 < z < 7.08. The remaining sources, represented with light grey circles, are those excluded owing to the selection criteria adopted, as explained above (e.g. X-ray flux upper limit, X-ray power-law slope ΓX too steep or too flat). The best-fit parameters obtained from the MCMC regression analysis on the full cleaned sample are represented by the green solid line, while the light green area covers the parameters space between the 16th and 84th percentile (γ = 0.53 ± 0.11, β = 27.43 ± 0.05, δintr = 0.20 ± 0.04, obtained with the sample of 31 objects). On the bottom, the residual between the data and the best-fit model. Right panel: log(LX) vs. log(LUV) plot. The full cleaned high-redshift sample (z > 4) is indicated in black and the sample at lower redshift by Lusso & Risaliti (2016) is indicated in cyan. It is clear that the quasars with z > 4 follow the same relation of those at the lowest redshift, suggesting that there is no evolution with cosmic time for the relation. On the bottom, the residual between the data and the model, obtained with the same MCMC regression analysis, on the collection of sources containing both samples represented (γ = 0.62 ± 0.09, β = 27.32 ± 0.16, δintr = 0.27 ± 0.04).
Current usage metrics show cumulative count of Article Views (full-text article views including HTML views, PDF and ePub downloads, according to the available data) and Abstracts Views on Vision4Press platform.
Data correspond to usage on the plateform after 2015. The current usage metrics is available 48-96 hours after online publication and is updated daily on week days.
Initial download of the metrics may take a while.