Fig. 1.
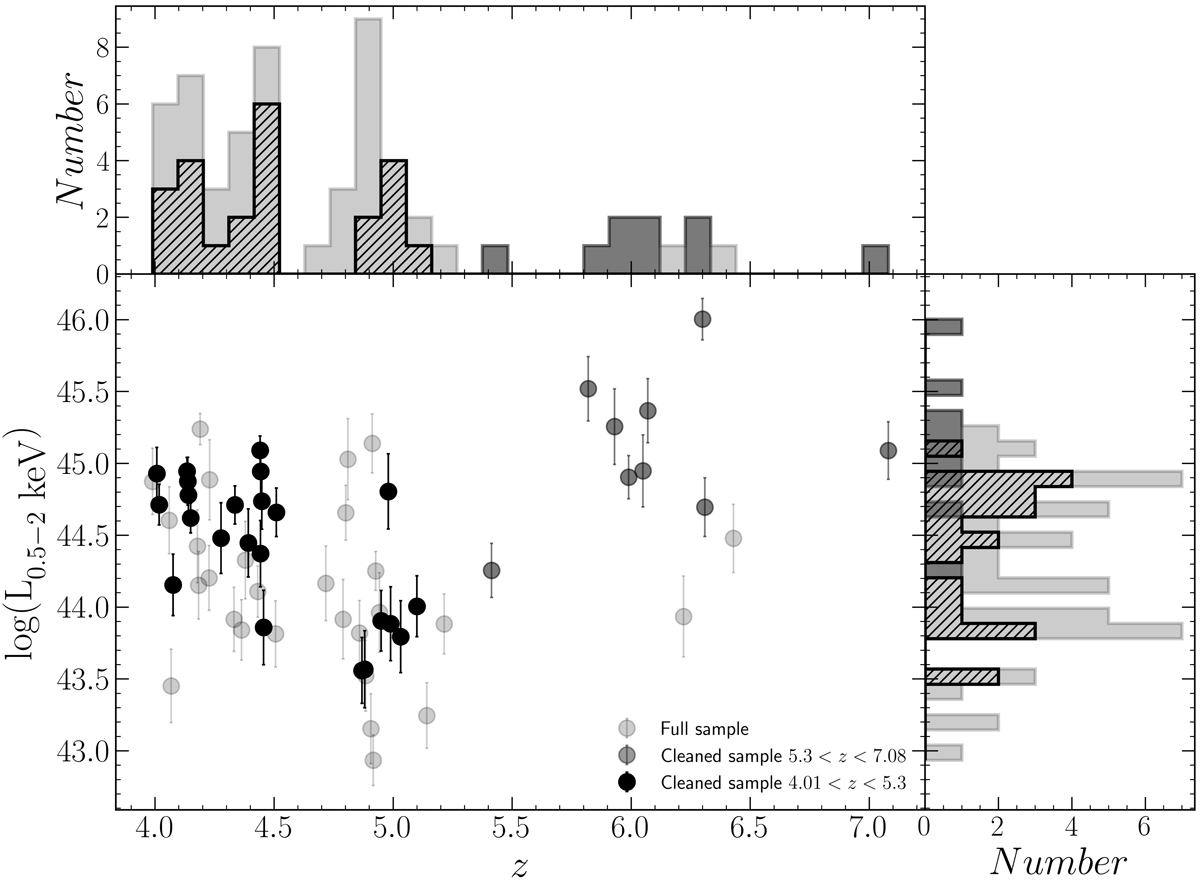
Central panel: distribution of the estimated rest-frame soft X-ray luminosity (0.5–2 keV) vs. redshift for the final sample. The cleaned sample of 22 sources with z < 5.3 are indicated in solid black; in dark grey we report those selected at z > 5.3 (9 out of 53); the remaining (22/53) in light grey indicate those not included in the analysis because of the selection criteria applied (e.g. X-ray flux upper limits or too steep or flat X-ray spectral slope). Top panel and right panel: redshift and soft X-ray luminosity distribution of the final quasar sample, respectively. The colour coding adopted is the same used in the central panel except for the hatched black filling instead of solid.
Current usage metrics show cumulative count of Article Views (full-text article views including HTML views, PDF and ePub downloads, according to the available data) and Abstracts Views on Vision4Press platform.
Data correspond to usage on the plateform after 2015. The current usage metrics is available 48-96 hours after online publication and is updated daily on week days.
Initial download of the metrics may take a while.