Open Access
Fig. 8.
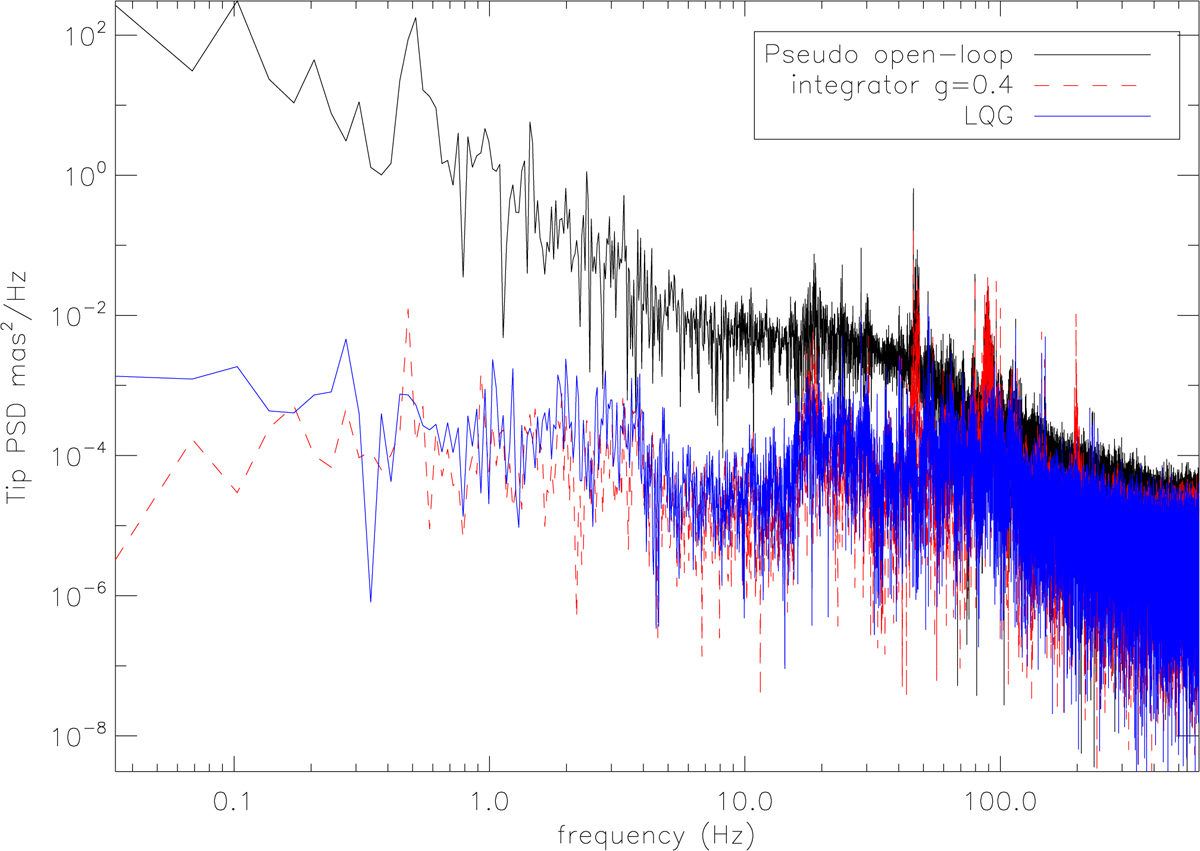
Example of tip mode power spectrum densities obtained on sky on HR 7710, as derived in pseudo-open loop (black), integrator with 0.4 gain (red) and LQG (blue) with clear vibrations at 18, 46 and 90 Hz, the origin of which is unknown. LQG dampens the vibration peaks, while the integrator amplifies the one at 90 Hz.
Current usage metrics show cumulative count of Article Views (full-text article views including HTML views, PDF and ePub downloads, according to the available data) and Abstracts Views on Vision4Press platform.
Data correspond to usage on the plateform after 2015. The current usage metrics is available 48-96 hours after online publication and is updated daily on week days.
Initial download of the metrics may take a while.