Fig. 23.
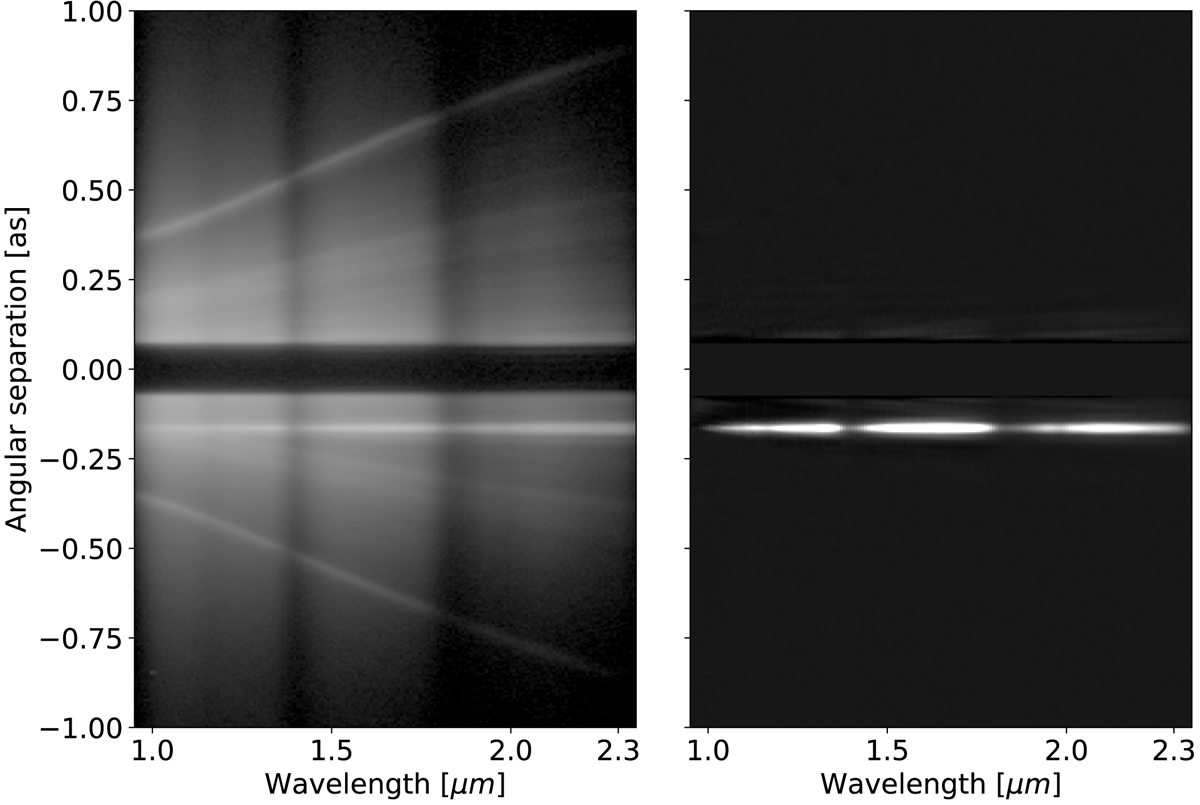
PZ Tel LRS data before (left) and after (right) speckle subtraction. The left image is the spectrum after pre-processing using the DRH pipeline (see Sect. 9.3). The spectrum of the companion PZ Tel B is visible as a straight line surrounded by speckles at an angular separation of ∼0.5″. The obscured part between ±0.2″ corresponds to the position of the opaque coronagraphic mask. The contrast of the companion is ∼5.4 mag in H-band (Biller et al. 2010). The right image present the data after stellar halo and speckles subtraction using the SDI approach described in (Vigan et al. 2008).
Current usage metrics show cumulative count of Article Views (full-text article views including HTML views, PDF and ePub downloads, according to the available data) and Abstracts Views on Vision4Press platform.
Data correspond to usage on the plateform after 2015. The current usage metrics is available 48-96 hours after online publication and is updated daily on week days.
Initial download of the metrics may take a while.