Fig. 15.
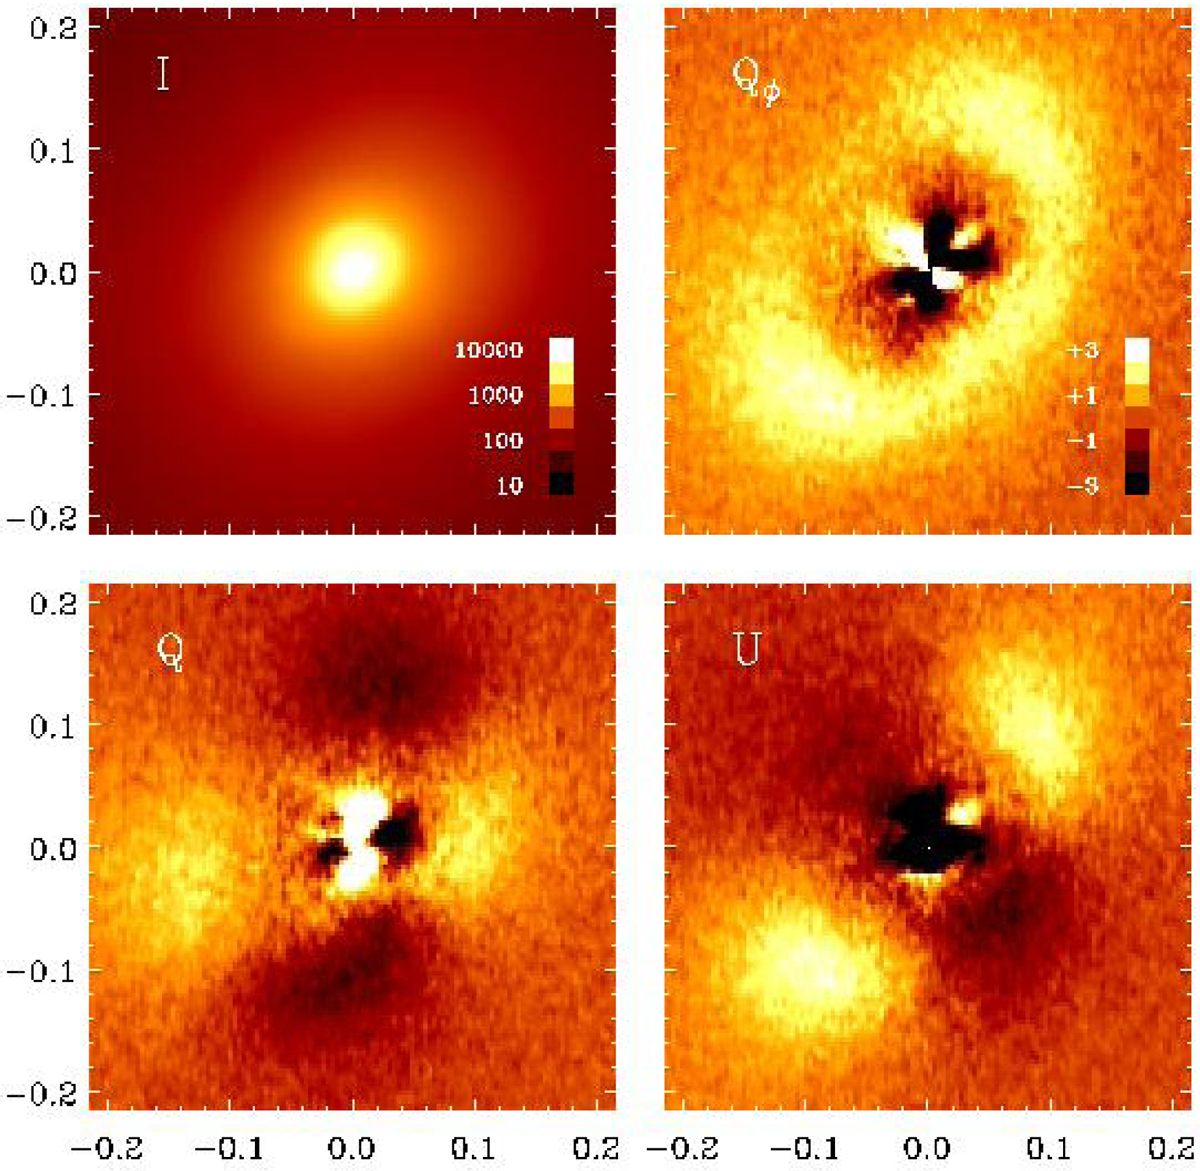
ZIMPOL polarimetry of the circumstellar disk of HD 100546. The panels show the intensity signal (top left), the Stokes Q and U intensities (lower row) and the polarized flux expressed as Qϕ in the top right panel. The color scale are given in units of cts per pixel and frame, and all polarimetric images are plotted on the same scale shown in the Qϕ panel.
Current usage metrics show cumulative count of Article Views (full-text article views including HTML views, PDF and ePub downloads, according to the available data) and Abstracts Views on Vision4Press platform.
Data correspond to usage on the plateform after 2015. The current usage metrics is available 48-96 hours after online publication and is updated daily on week days.
Initial download of the metrics may take a while.