Fig. 4
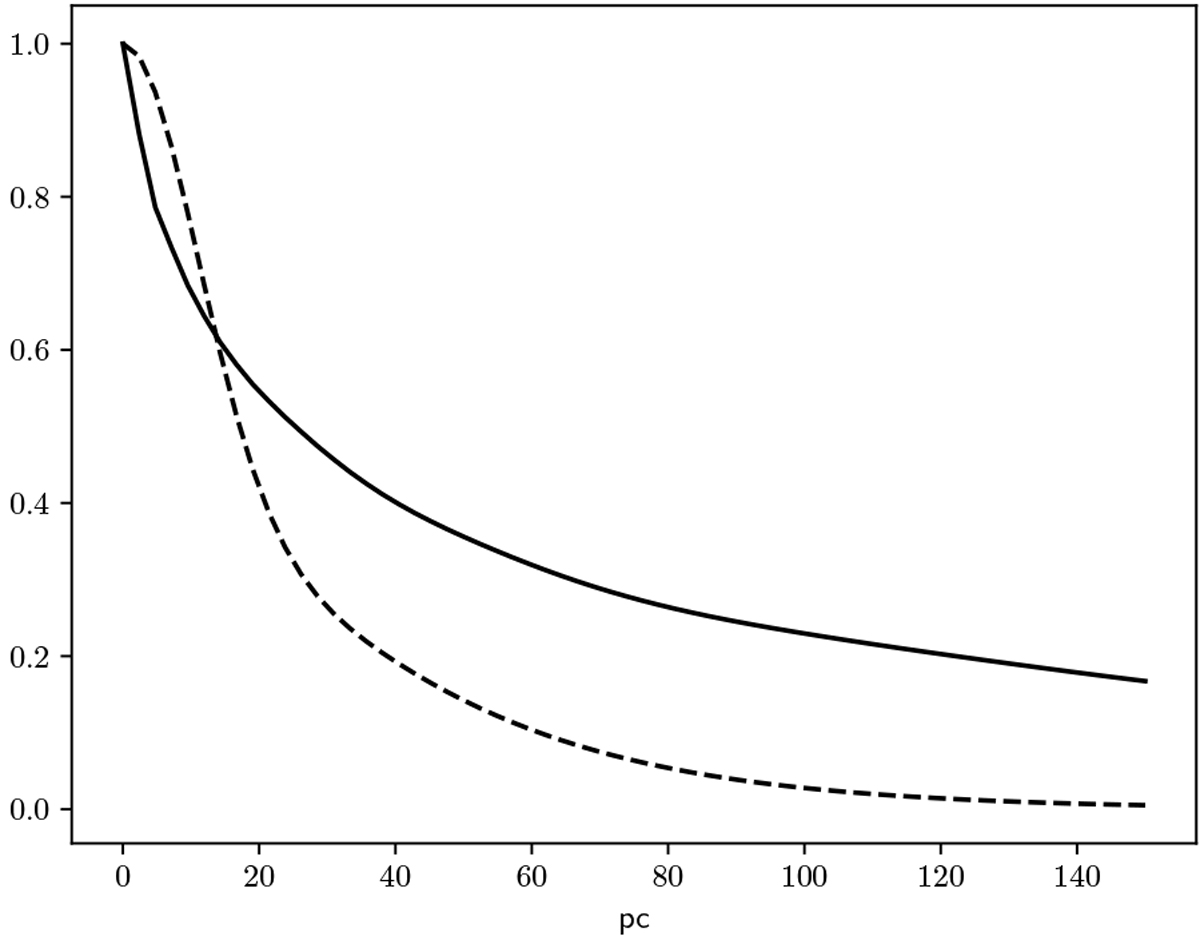
Log-normal process normalized two-point correlation reconstructed by our method (solid line) and imposed in the reconstruction by Lallement et al. (2018) (dashed line). One can see that the dust is assumed to be strongly correlated at a distance scale of up to about 30 pc. This plot shows normalized 1D cuts through the 3D Fourier transform of the log-normal spatial correlation power spectrum shown in Fig. 7.
Current usage metrics show cumulative count of Article Views (full-text article views including HTML views, PDF and ePub downloads, according to the available data) and Abstracts Views on Vision4Press platform.
Data correspond to usage on the plateform after 2015. The current usage metrics is available 48-96 hours after online publication and is updated daily on week days.
Initial download of the metrics may take a while.