Fig. 12
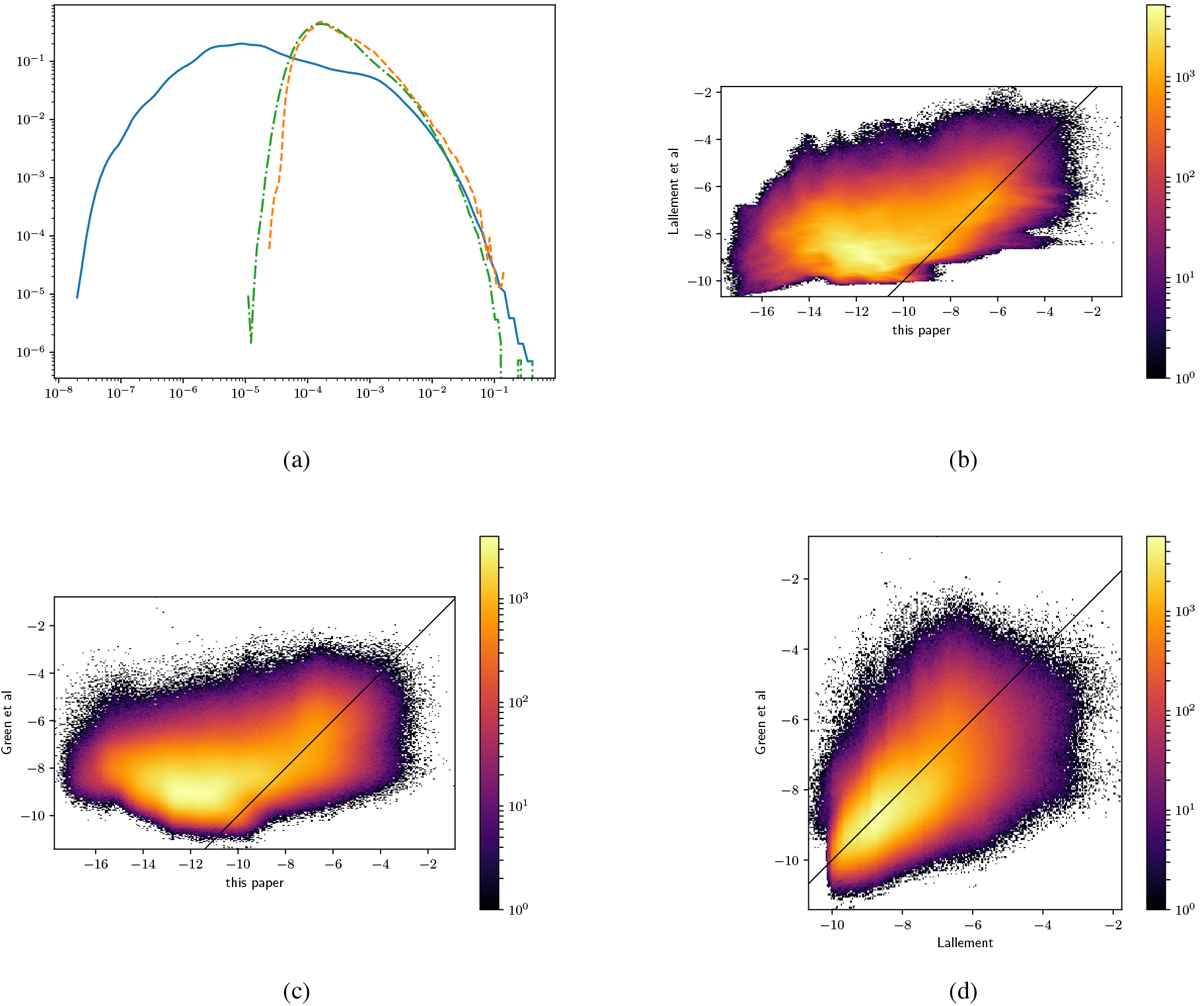
Normalized histograms of dust densities (panel a) and heat maps of voxel-wise correlations (panels b–d). The solid line corresponds to our reconstruction, while the dashed line is the reconstruction of Lallement et al. (2018) and the dash-dotted line is the reconstruction of Green et al. (2018). The other three plots are heat maps of voxel-wise correlations between reconstructed logarithmic dust densities, where the colors show bin counts. The black line in the heat maps is the identity function, corresponding to perfect correlation.
Current usage metrics show cumulative count of Article Views (full-text article views including HTML views, PDF and ePub downloads, according to the available data) and Abstracts Views on Vision4Press platform.
Data correspond to usage on the plateform after 2015. The current usage metrics is available 48-96 hours after online publication and is updated daily on week days.
Initial download of the metrics may take a while.