Fig. 6.
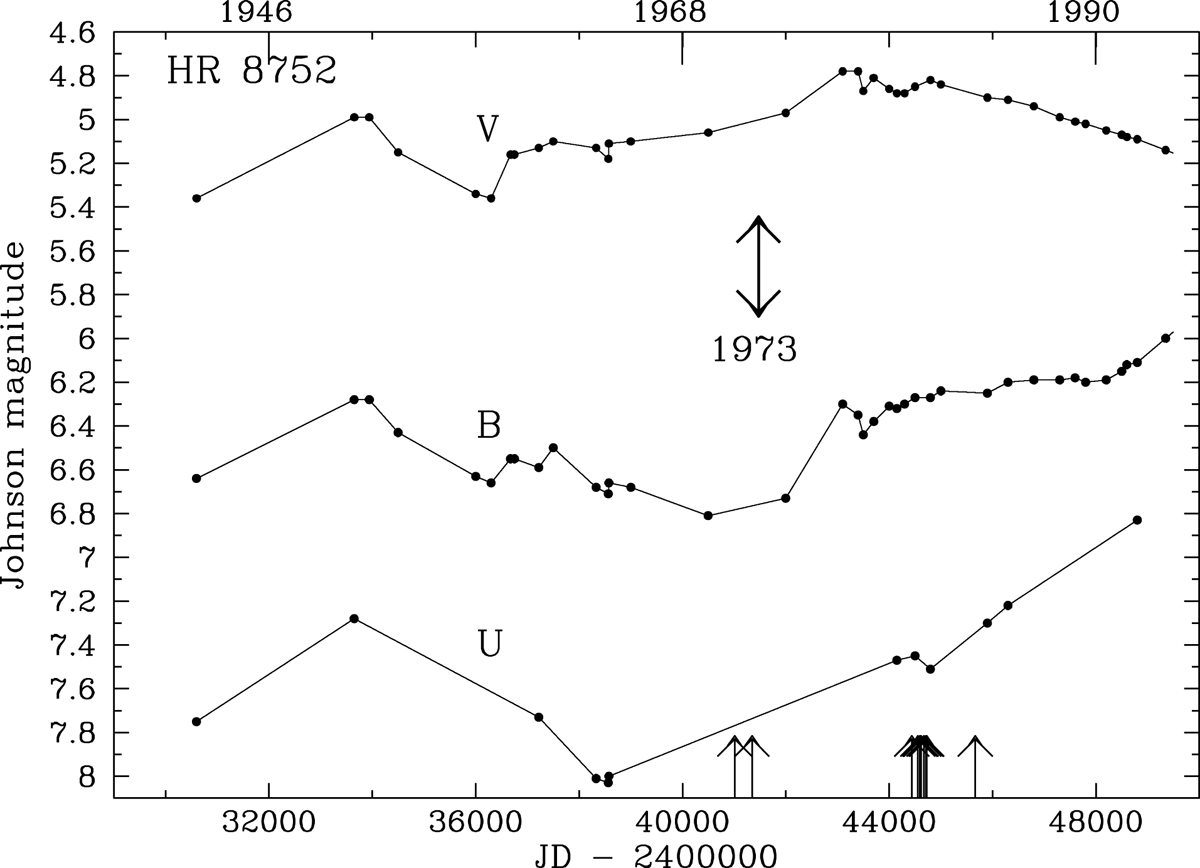
Long-term variables of HR 8752 in V, B, and U in 1942–1994. The arrows at the bottom indicate dates of spectroscopic observations by Smolinski et al. (1989), taken in 1969 and 1970, and between 1979 and 1982; see also de Jager (1998, Figs. 9 and 10 in Sect. 7). These spectroscopic observations signalled the presence of an enhanced mass-loss episode and a massive eruption in 1973 (arrow), which was not photometrically recorded (Nieuwenhuijzen et al. 2012). We note that after 1979 (∼JD 24 44000) only V declined; see text.
Current usage metrics show cumulative count of Article Views (full-text article views including HTML views, PDF and ePub downloads, according to the available data) and Abstracts Views on Vision4Press platform.
Data correspond to usage on the plateform after 2015. The current usage metrics is available 48-96 hours after online publication and is updated daily on week days.
Initial download of the metrics may take a while.