Fig. 3.
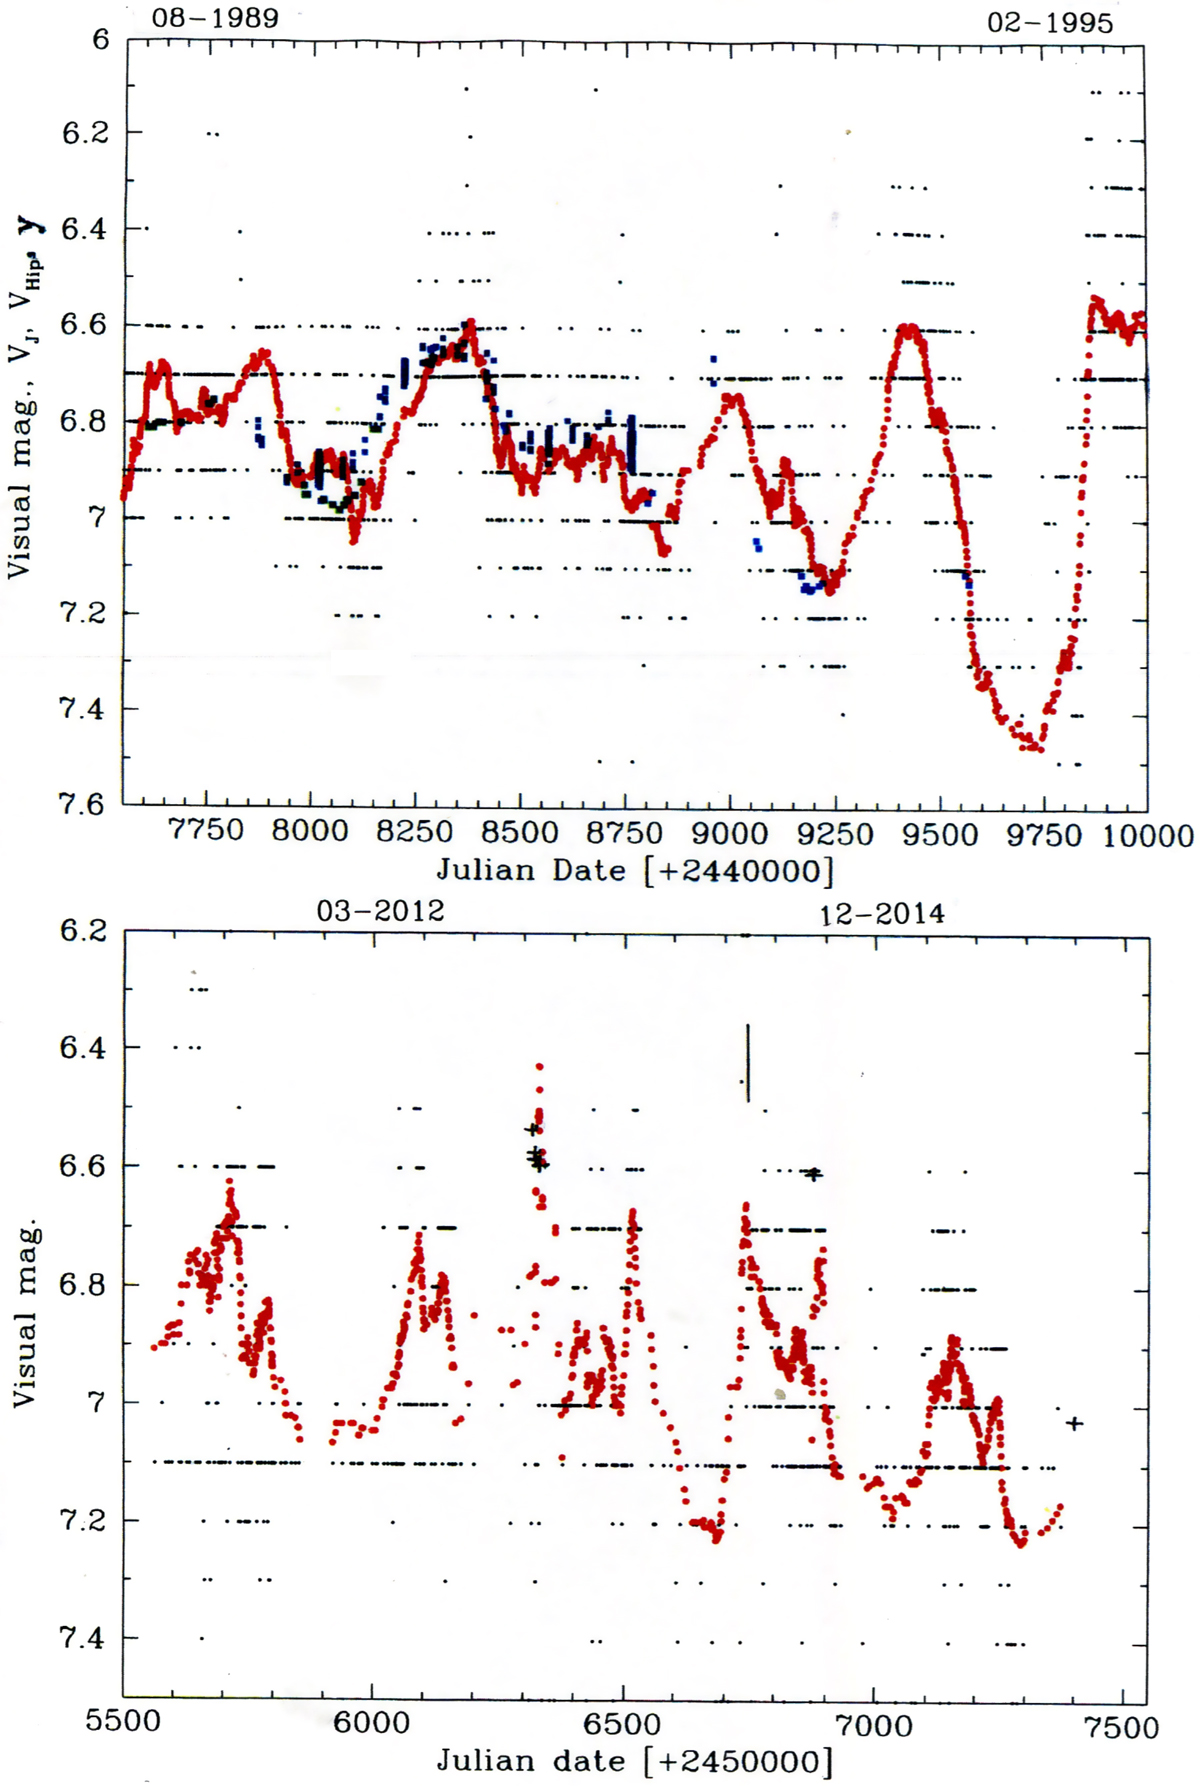
Upper panel: 1989–1995 pulsations of HR 5171A in the visual (the averages of the AAVSO data shifted upward by ![]() (black dots) from which smoothed averages were derived: the red dots). Other data points are added (e.g. Chesneau et al. 2014): the V (Johnson system, transformed from the V of the VBLUW Walraven system, light green squares), the HIPPARCOS Hp magnitudes shifted by
(black dots) from which smoothed averages were derived: the red dots). Other data points are added (e.g. Chesneau et al. 2014): the V (Johnson system, transformed from the V of the VBLUW Walraven system, light green squares), the HIPPARCOS Hp magnitudes shifted by ![]() downwards (dark blue squares), and the y (uvby) Strömgren system, shifted by
downwards (dark blue squares), and the y (uvby) Strömgren system, shifted by ![]() upwards (light blue, cyan squares). In this way all data fit the V (Johnson system) magnitude scale satisfactorily. The deepest minimum on the right (∼JD 244 9750) is called the Jones-Williams minimum. Lower panel: (we highlight the small scale difference between both JD axes) 2010–2016 pulsations (based on AAVSO data). The last pulsation on the right with the minimum at ∼JD 24 57330 (early October 2015) is called the Blown-minimum. Six photo-electric BV data (Johnson system) and RI (Cousins system) observed by one of the present authors (GDS) are only for V represented by a “+”, and are listed in Table I.1 together with four more recent observations. No magnitude scale shift has been applied. The vertical line piece at JD 24 56755 (2014) marks the date of an AMBER/VLTI observation by Wittkovski et al. (2017a); see text.
upwards (light blue, cyan squares). In this way all data fit the V (Johnson system) magnitude scale satisfactorily. The deepest minimum on the right (∼JD 244 9750) is called the Jones-Williams minimum. Lower panel: (we highlight the small scale difference between both JD axes) 2010–2016 pulsations (based on AAVSO data). The last pulsation on the right with the minimum at ∼JD 24 57330 (early October 2015) is called the Blown-minimum. Six photo-electric BV data (Johnson system) and RI (Cousins system) observed by one of the present authors (GDS) are only for V represented by a “+”, and are listed in Table I.1 together with four more recent observations. No magnitude scale shift has been applied. The vertical line piece at JD 24 56755 (2014) marks the date of an AMBER/VLTI observation by Wittkovski et al. (2017a); see text.
Current usage metrics show cumulative count of Article Views (full-text article views including HTML views, PDF and ePub downloads, according to the available data) and Abstracts Views on Vision4Press platform.
Data correspond to usage on the plateform after 2015. The current usage metrics is available 48-96 hours after online publication and is updated daily on week days.
Initial download of the metrics may take a while.