Fig. 2.
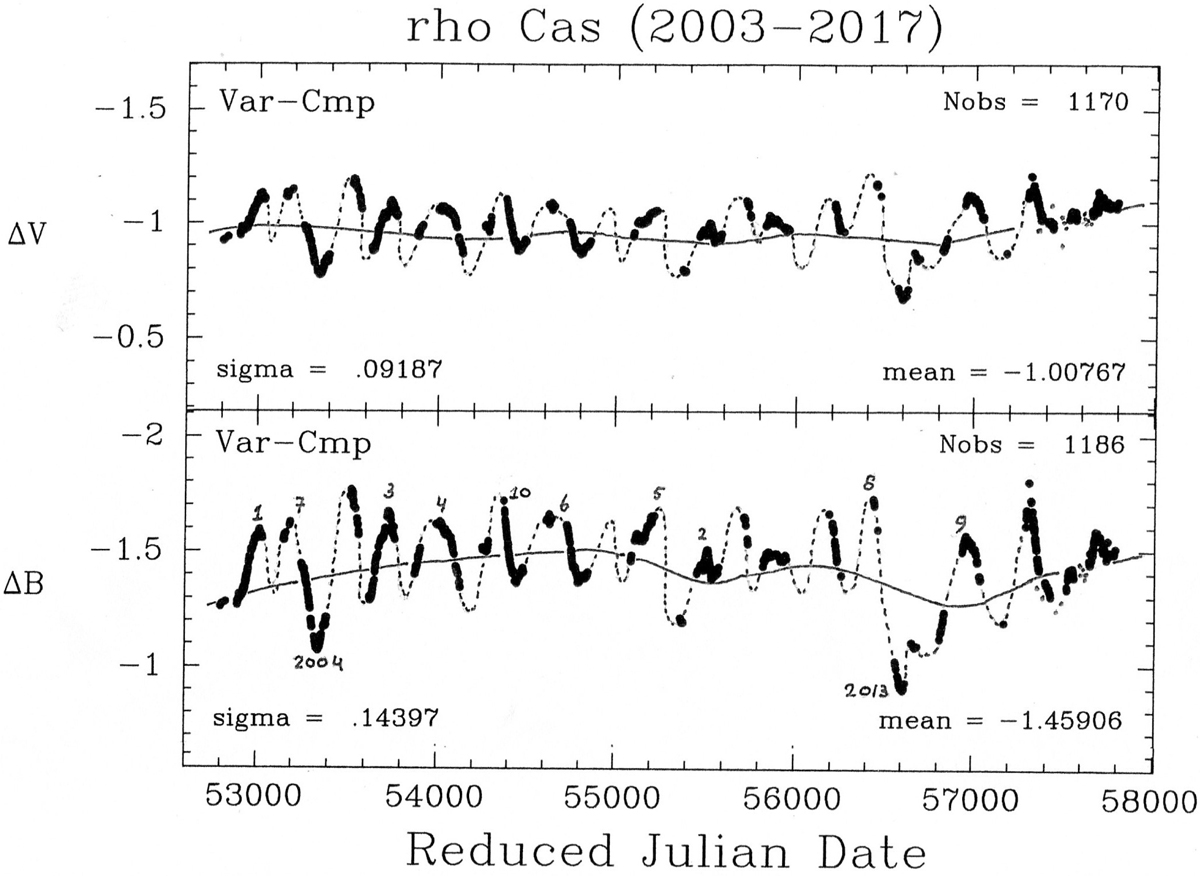
2003–2017 time-series in B and V (UBV) of ρ Cas relative to the comparison star by the T3 APT project (Henry 1995, 1999). Small dots on the right in V and B are observations made by one of the present authors (EJvB; see Appendix B). The mean curves sketched through the median magnitudes of the pulsations are the LTVs, in V almost constant, in B clearly present. Some numbers in the B light curve represent pulsations quoted in the text. The sequence contains one new but weak eruption: 2013 (labelled no. 8 in the B-panel and recognizable by its deep minimum). The pulsation in 2004, labelled no. 7, has a relatively deep minimum, but is not an eruption episode. Spectral temperatures were derived by Klochkova et al. (2014) between JD 24 54168 and JD 24 55819.
Current usage metrics show cumulative count of Article Views (full-text article views including HTML views, PDF and ePub downloads, according to the available data) and Abstracts Views on Vision4Press platform.
Data correspond to usage on the plateform after 2015. The current usage metrics is available 48-96 hours after online publication and is updated daily on week days.
Initial download of the metrics may take a while.