Fig. J.1.
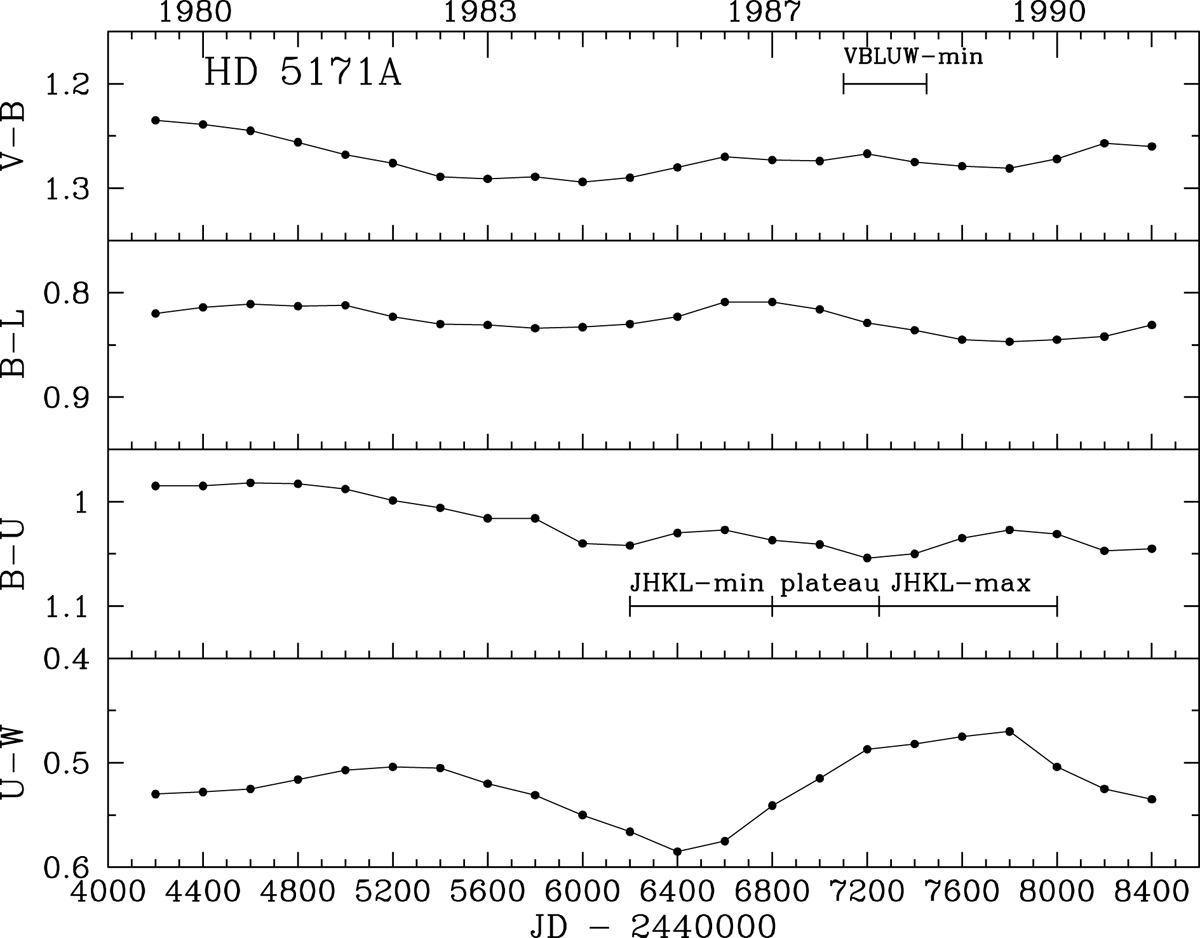
Long-term variations of HR 5171A in the four colour indices (in logarithmic scale) of the medium broadband VBLUW system 1980–1991, showing a slightly undulating reddening trend for the V − B (equivalent to the (B − V) of the UBV system), B − L and B − U colour indices. Blue is up. The U − W curve behaves differently, showing two oscillations due to Balmer continuum brightness changes with a timescale of about 2000 d. The last maximum (∼JD 24 47600) has an amplitude of about ![]() . This maximum and the preceding minimum might be related to a local maximum or plateau and a minimum, respectively, in the K light curve (thus, also likely present in the other NIR bands). Bars labeled with “JHKL-etc” in the (B − U) panel will be discussed in the next paper.
. This maximum and the preceding minimum might be related to a local maximum or plateau and a minimum, respectively, in the K light curve (thus, also likely present in the other NIR bands). Bars labeled with “JHKL-etc” in the (B − U) panel will be discussed in the next paper.
Current usage metrics show cumulative count of Article Views (full-text article views including HTML views, PDF and ePub downloads, according to the available data) and Abstracts Views on Vision4Press platform.
Data correspond to usage on the plateform after 2015. The current usage metrics is available 48-96 hours after online publication and is updated daily on week days.
Initial download of the metrics may take a while.