Fig. 15.
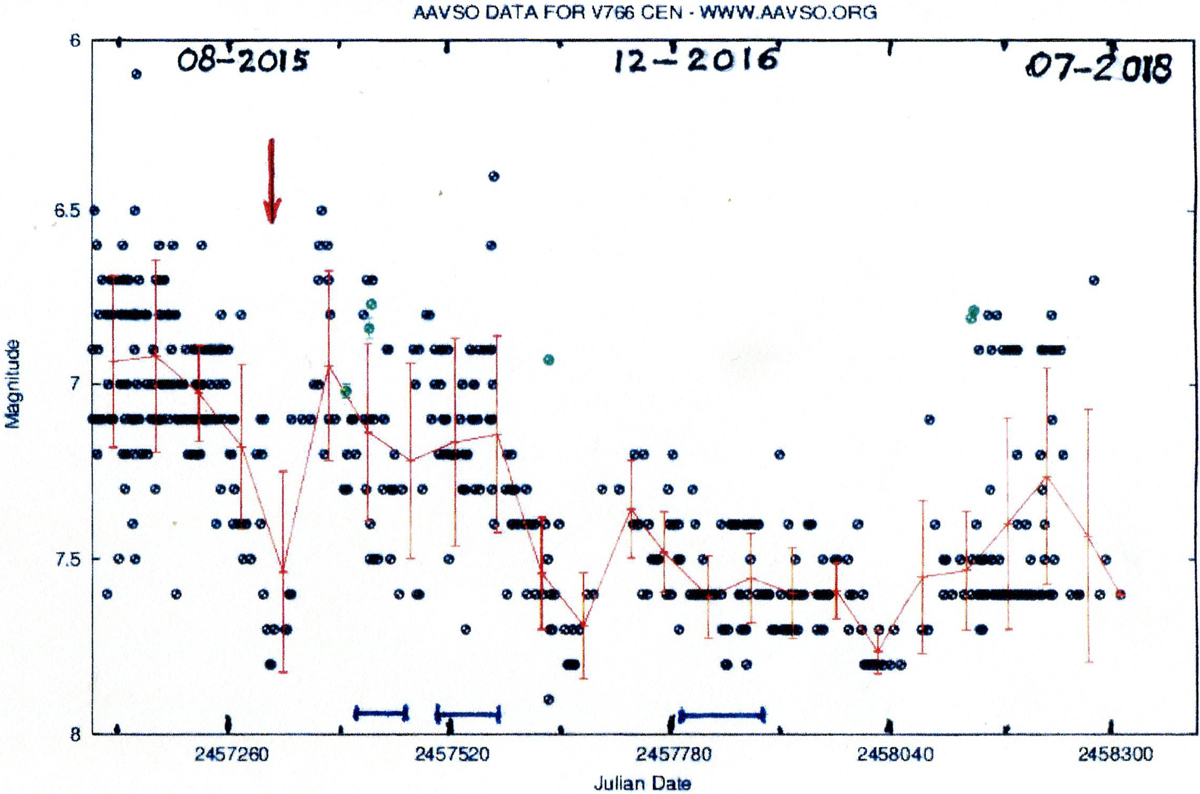
Visual AAVSO light curve 2011–2018 (red lines based on 50 d averages) of HR 5171A showing the last normal pulsation with the Blown-minimum (red arrow at ∼JD 24 57330, early October 2015, cf. second panel of Fig. 3), during an observed portion of the BL evolution showing sudden decreasing quasi-periods and declining light amplitudes. The behaviour after JD 24 57650 is similar to those exhibited by HR 8752 and HD 179821 during their BLs. The green dots are the photo-electric V observations from Table I.1, which are brighter than the visual estimates by ![]() as expected. The visual ones should be shifted upwards, but for clarity this was not done. See text for further explanation.
as expected. The visual ones should be shifted upwards, but for clarity this was not done. See text for further explanation.
Current usage metrics show cumulative count of Article Views (full-text article views including HTML views, PDF and ePub downloads, according to the available data) and Abstracts Views on Vision4Press platform.
Data correspond to usage on the plateform after 2015. The current usage metrics is available 48-96 hours after online publication and is updated daily on week days.
Initial download of the metrics may take a while.