Fig. 14.
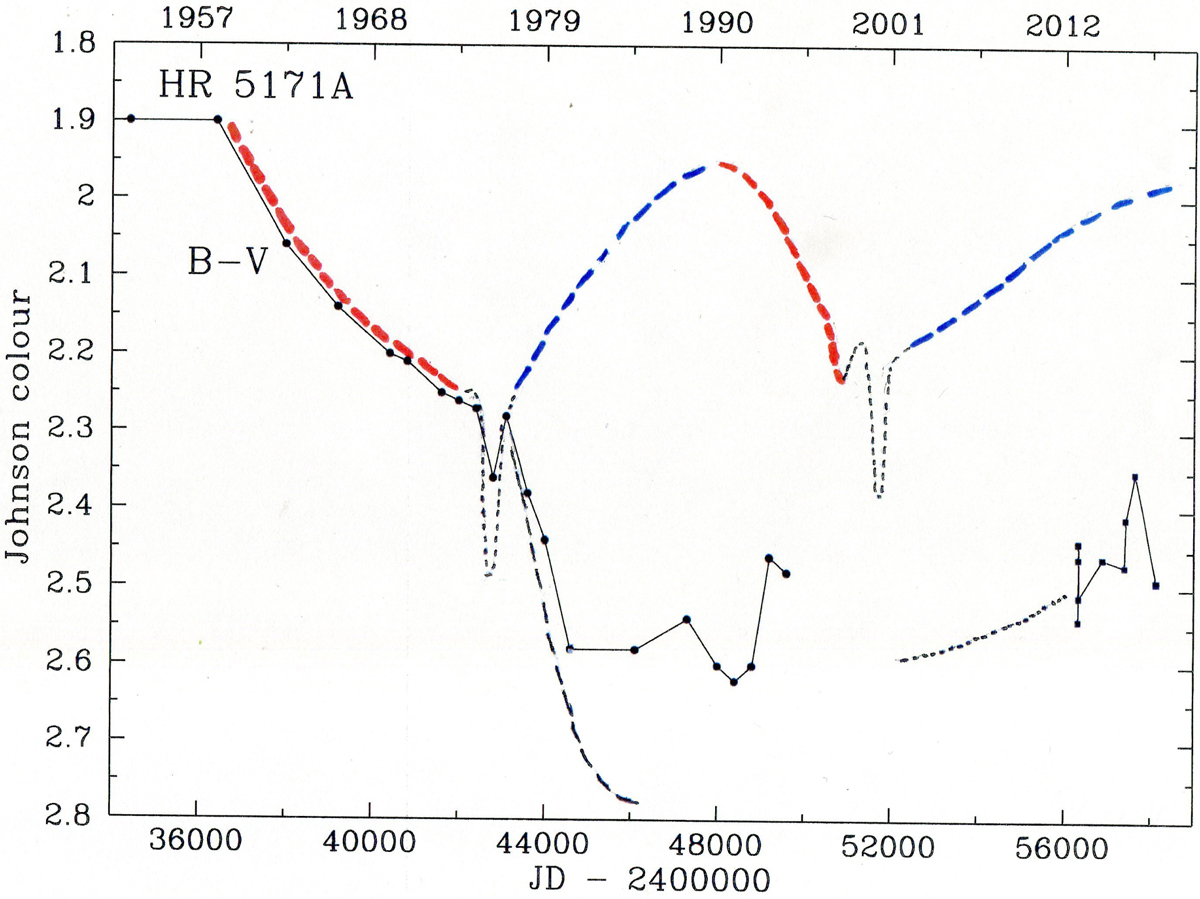
Similar to Fig. 13, but for the observed LTV of (B − V) of HR 5171A, 1953–2018: the black dots connected by black lines. We note the long-lasting reddening episode between ∼JD 24 37000 (1960) and ∼JD 24 44500 (1981). All other curves are only schematic. In red and blue: the (B − V) variations due to the RL and BL evolutions, respectively; black dotted peaks: the Dean-1975 and Otero-2000 eruptions; black dotted curve below and on the very right: the supposed blueing trend; black dashed curve running steeply downward: the supposed reddening by a shell ejection after the 1975 eruption. The result of the latter and the BL evolution above is the observed reddening of the LTV: the black dots connected by black lines between the 1975 eruption and ∼JD 24 46000. In the time interval between JD 24 50000 and JD 24 56000 (1994–2013) only visual observations were made. The small dataset (squares) on the very right (2013–2018) represents individual photoelectric observations by GDS (Table I.1); see Fig. 15 for the detailed visual light curve at the time.
Current usage metrics show cumulative count of Article Views (full-text article views including HTML views, PDF and ePub downloads, according to the available data) and Abstracts Views on Vision4Press platform.
Data correspond to usage on the plateform after 2015. The current usage metrics is available 48-96 hours after online publication and is updated daily on week days.
Initial download of the metrics may take a while.