Fig. 13.
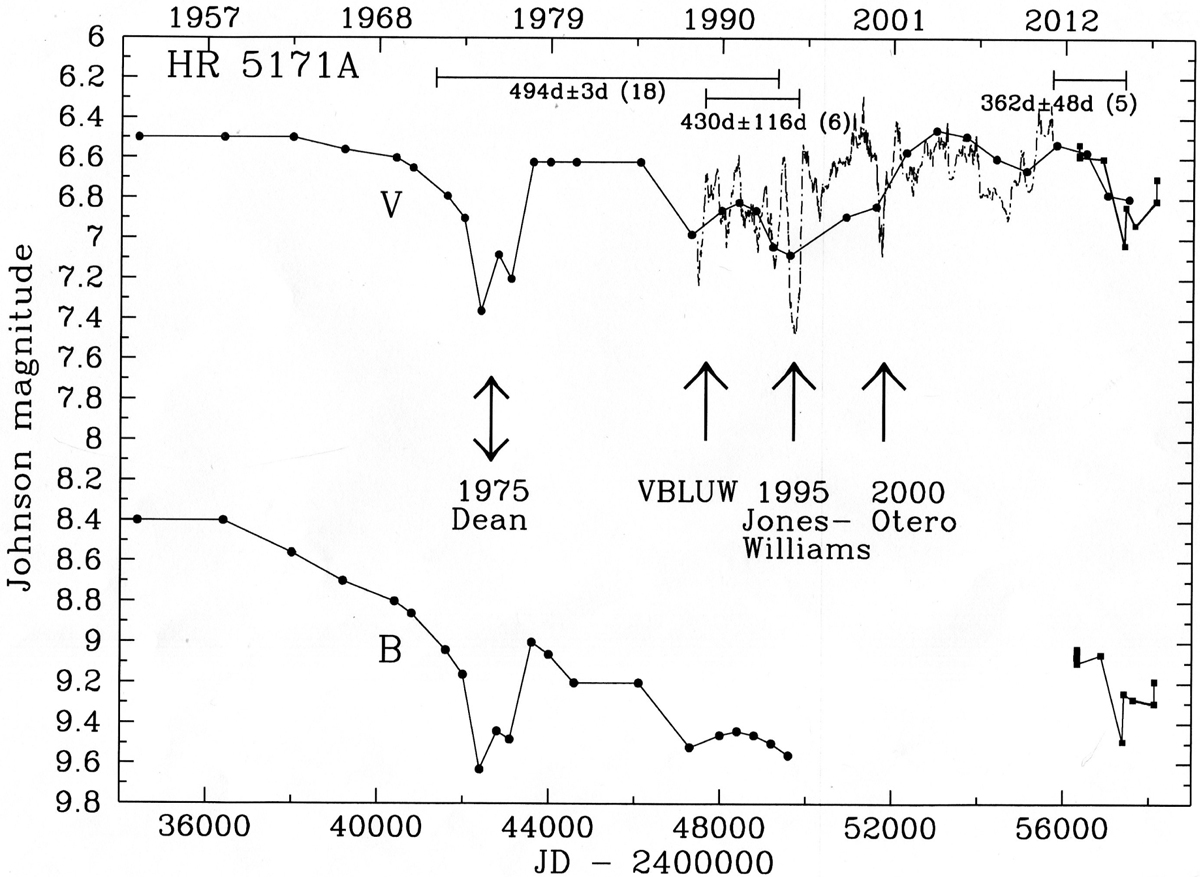
Long-term variables for V and B of HR 5171A 1953–2018. Time intervals (with mean quasi-periods and the sigma) are indicated by bars at the top. Bracketed numbers are the number of cycles. The mean quasi-period (494d) between 1970 and 1993 is based on a least-squares solution by van Leeuwen et al. (1998). See text for a discussion on the mean quasi-periods after ∼2000 (Sect. 3.1). The dashed light curve is based on the visual AAVSO data. The Otero-minimum is part of the massive 2000 eruption. Local brightness minima (of LTVs), or of individual pulsations are: the VBLUW minimum (JD 24 47300), the Jones–Williams minimum (the deepest one at the time, JD 24 49750), and the Blown-minimum at JD 24 57330. The last two minima are identifiable in the upper and lower panels of Fig. 3, respectively. The squares on the very right are individual BV observations made by GDS between 2013 and 2018 (Table I.1); see Fig. 15 for a detailed visual light curve in the same time interval. In this time interval (∼JD 24 56755, 2014) the temperature was determined by Wittkovski et al. (2017a): 4290 K ± 760 K.
Current usage metrics show cumulative count of Article Views (full-text article views including HTML views, PDF and ePub downloads, according to the available data) and Abstracts Views on Vision4Press platform.
Data correspond to usage on the plateform after 2015. The current usage metrics is available 48-96 hours after online publication and is updated daily on week days.
Initial download of the metrics may take a while.