Fig. 12.
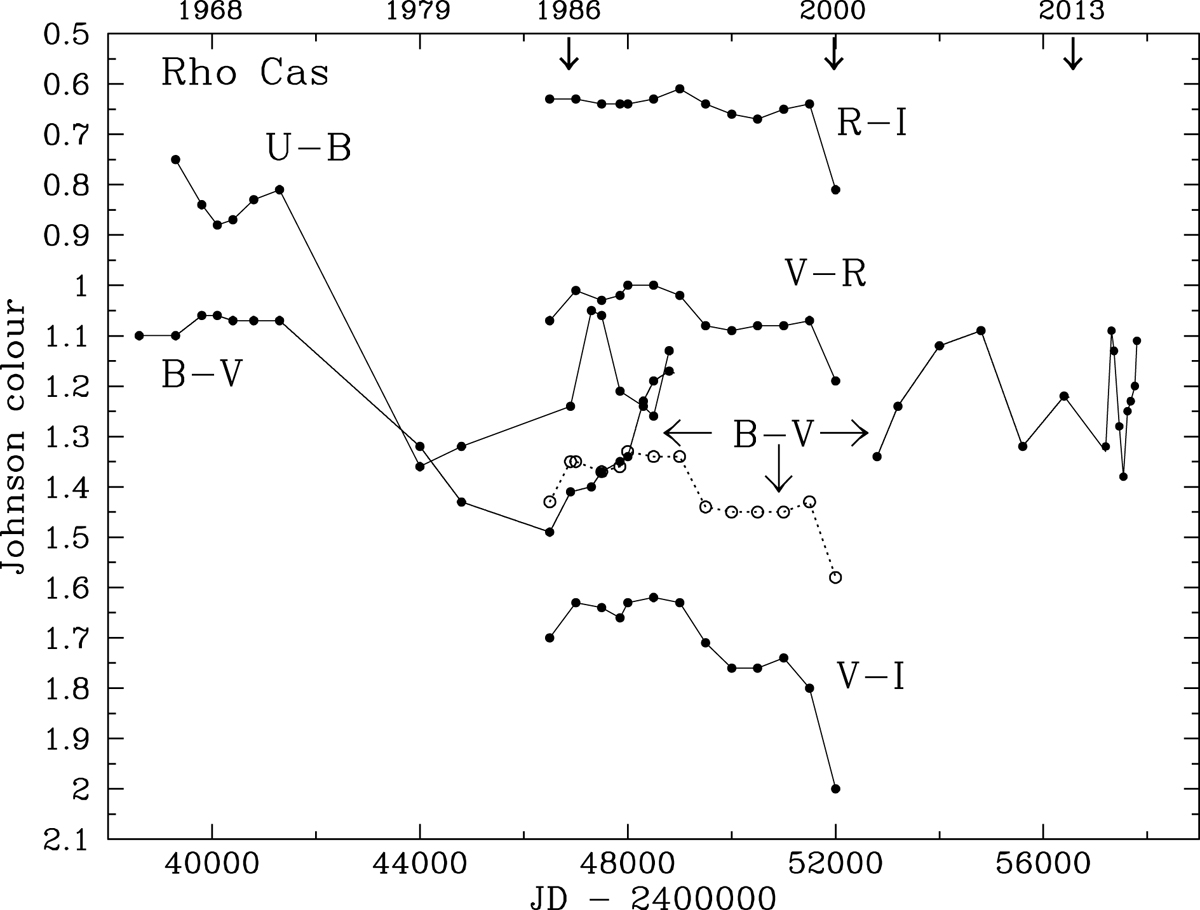
Similar to Fig. 11 but for the five colour indices of the UBVRI (Johnson system) of ρ Cas between 1965 and 2017. The (B − V) data points represented by circles are based on a (V − R)/(B − V) relation when no B observations were made (Fig. 11). The arrows and the dates at the top mark eruptive episodes. We note that eruptions preferably take place when the LTV of (B − V) is relatively red, therefore when the star resides in the red part on the HR diagram.
Current usage metrics show cumulative count of Article Views (full-text article views including HTML views, PDF and ePub downloads, according to the available data) and Abstracts Views on Vision4Press platform.
Data correspond to usage on the plateform after 2015. The current usage metrics is available 48-96 hours after online publication and is updated daily on week days.
Initial download of the metrics may take a while.