Fig. 11.
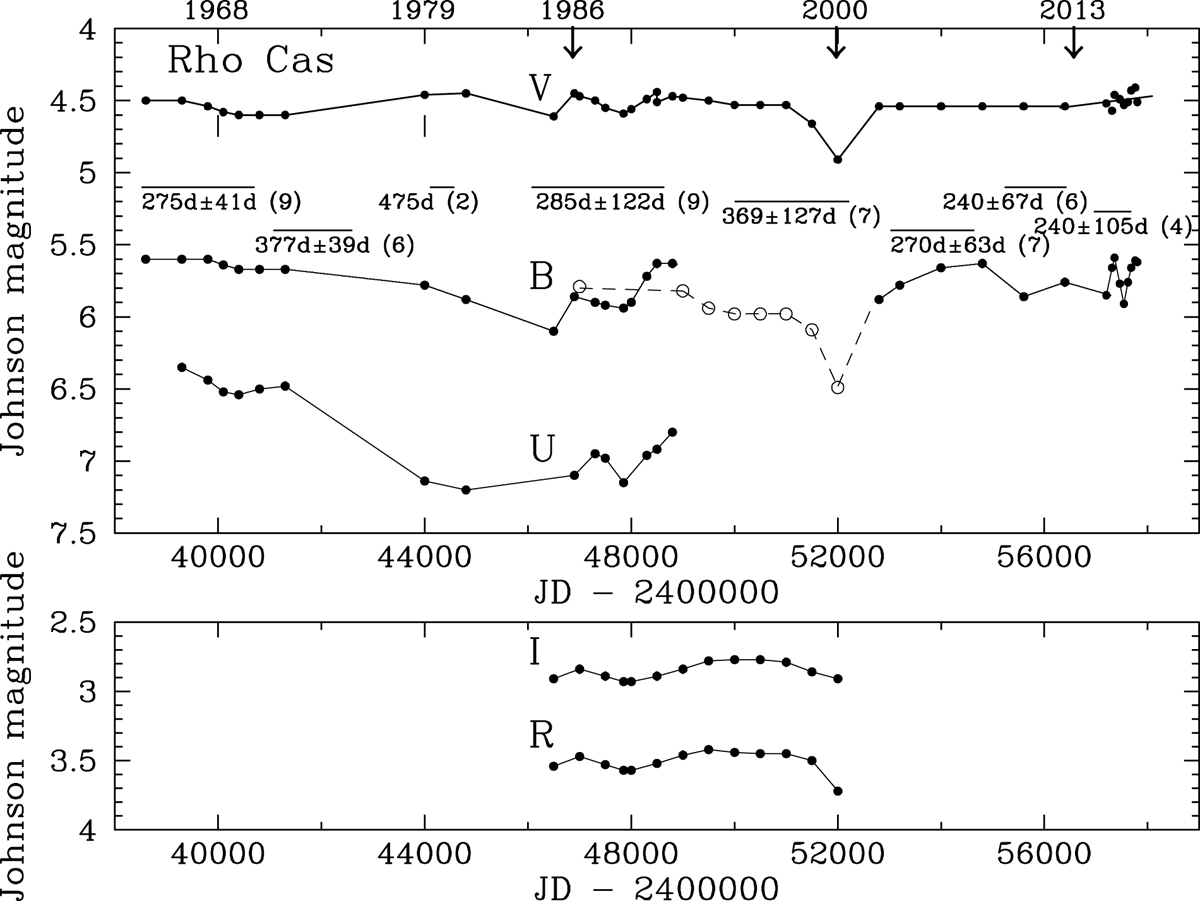
Long-term variations in the brightness UBVRI (Johnson system) of ρ Cas between 1965 and 2017. The arrows and the dates at the top mark eruptive episodes. Data points at JD ∼ 24 58000 are observations by EJvB. Between the V and B light curves the mean quasi-periods are shown with their σ for some selected time intervals. Their mean durations are represented by the length of the bars. The number of cycles used are bracketed. A correlation between the trend of the mean quasi-periods and the (B − V) is obvious: they increase and decrease when the (B − V) becomes red and blue, respectively (while V is almost constant, B shows a cyclic fainting and brightening before and after an eruption). The eight B-data points represented by circles are based on a (V − R)/(B − V) relation when no B observations were made.
Current usage metrics show cumulative count of Article Views (full-text article views including HTML views, PDF and ePub downloads, according to the available data) and Abstracts Views on Vision4Press platform.
Data correspond to usage on the plateform after 2015. The current usage metrics is available 48-96 hours after online publication and is updated daily on week days.
Initial download of the metrics may take a while.