Fig. 1.
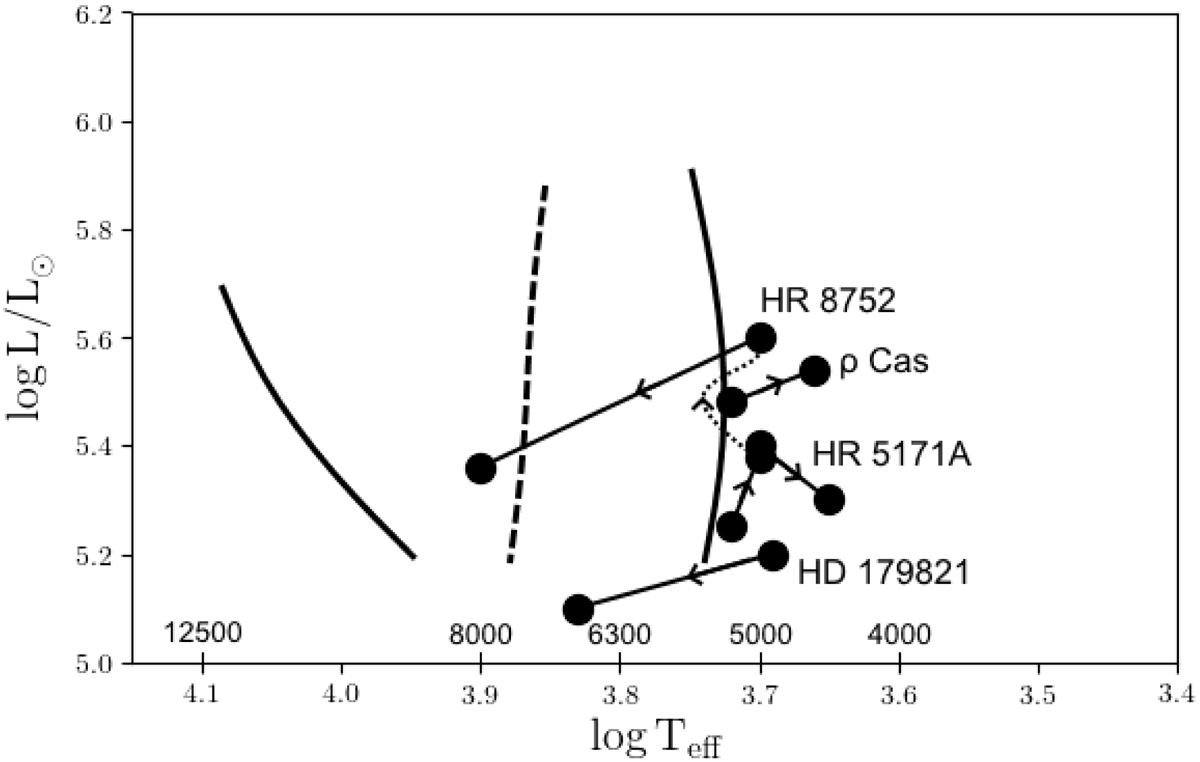
Schematic HR diagram: on the right and left of the vertical dashed line the Yellow Void and the Yellow-Blue Void, respectively (data in Table A.1: data summary of the appendix). The diagram shows the extreme physical and photometric values of one or two (HR 8752) selected RL or BL evolutionary tracks of the program stars (arrows). Most of the extreme values are accidentally concentrated near the vertical curve on the right, the curve where H is close to beginning their ionization.
Current usage metrics show cumulative count of Article Views (full-text article views including HTML views, PDF and ePub downloads, according to the available data) and Abstracts Views on Vision4Press platform.
Data correspond to usage on the plateform after 2015. The current usage metrics is available 48-96 hours after online publication and is updated daily on week days.
Initial download of the metrics may take a while.