Fig. A.1.
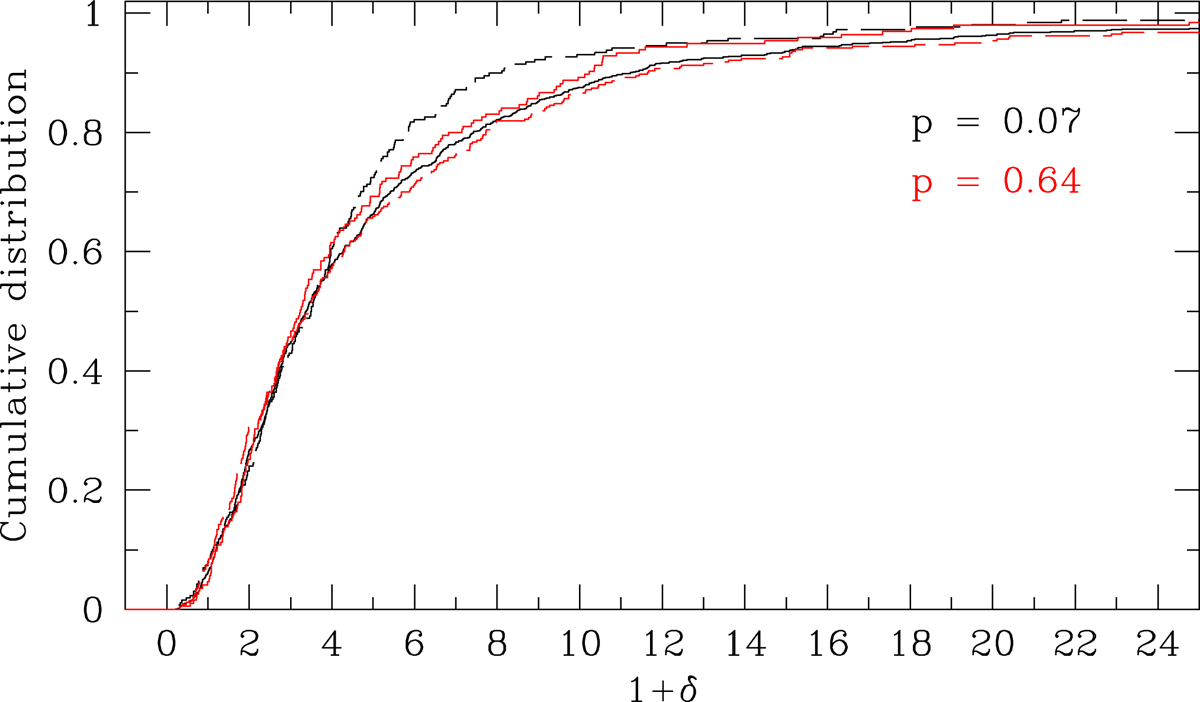
Cumulative distribution of (1 + δ) for MPGs with reliable Re and δ at 0.5 ≤ z ≤ 0.8 (black solid line) and at 0.8 < z ≤ 0.9 (dashed black line). The probability p that the two distributions are extracted from the same parent sample is rejected at ∼3σ. Red solid and dashed lines indicate the cumulative distribution for MPGs at 0.5 ≤ z ≤ 0.6 and 0.7 ≤ z ≤ 0.8, respectively. The probability that they are extracted from the same parent sample is 0.64.
Current usage metrics show cumulative count of Article Views (full-text article views including HTML views, PDF and ePub downloads, according to the available data) and Abstracts Views on Vision4Press platform.
Data correspond to usage on the plateform after 2015. The current usage metrics is available 48-96 hours after online publication and is updated daily on week days.
Initial download of the metrics may take a while.