Fig. 8.
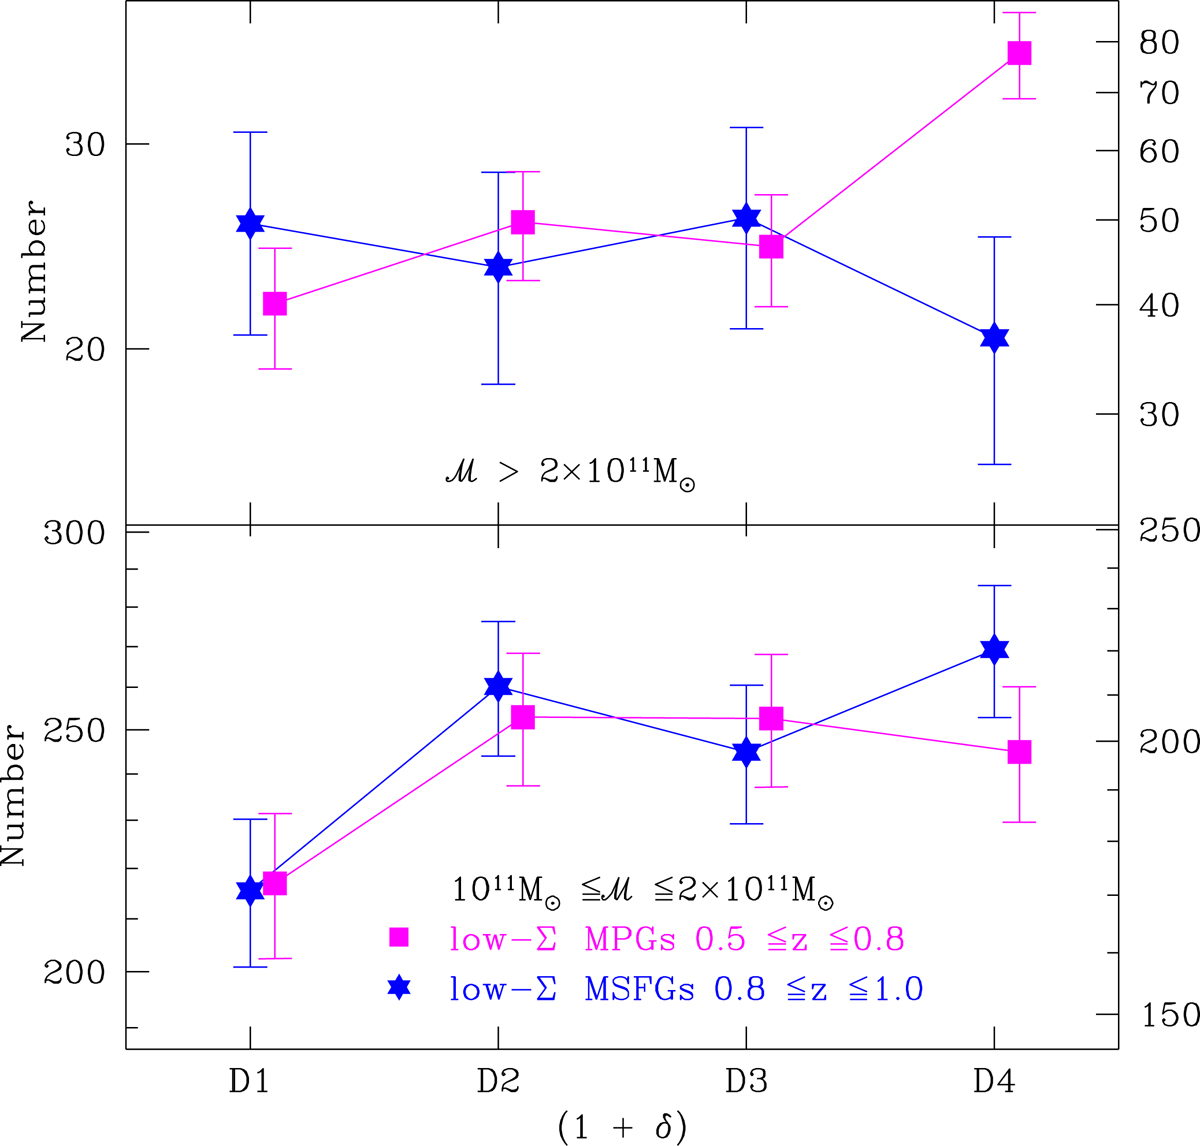
Lower panel: number of low-Σ MSFGs at 0.8 ≤ z ≤ 1.0 (blue stars) with 1011 M⊙ ≤ ℳ ≤ 2 × 10¹¹ M⊙ as a function of local density δ. For comparison, we also report the number of low-Σ MPGs at 0.5 ≤ z ≤ 0.8 (magenta squares) with 1011 M⊙ ≤ ℳ ≤ 2 × 10¹¹ M⊙. Their values are reported on the right y-axis. The four δ bins correspond to the four quartiles of the MPG (1 + δ) distribution. Upper panel: same as in the lower panel, but for MPGs with ℳ > 2 × 10¹¹ M⊙.
Current usage metrics show cumulative count of Article Views (full-text article views including HTML views, PDF and ePub downloads, according to the available data) and Abstracts Views on Vision4Press platform.
Data correspond to usage on the plateform after 2015. The current usage metrics is available 48-96 hours after online publication and is updated daily on week days.
Initial download of the metrics may take a while.