Fig. 5.
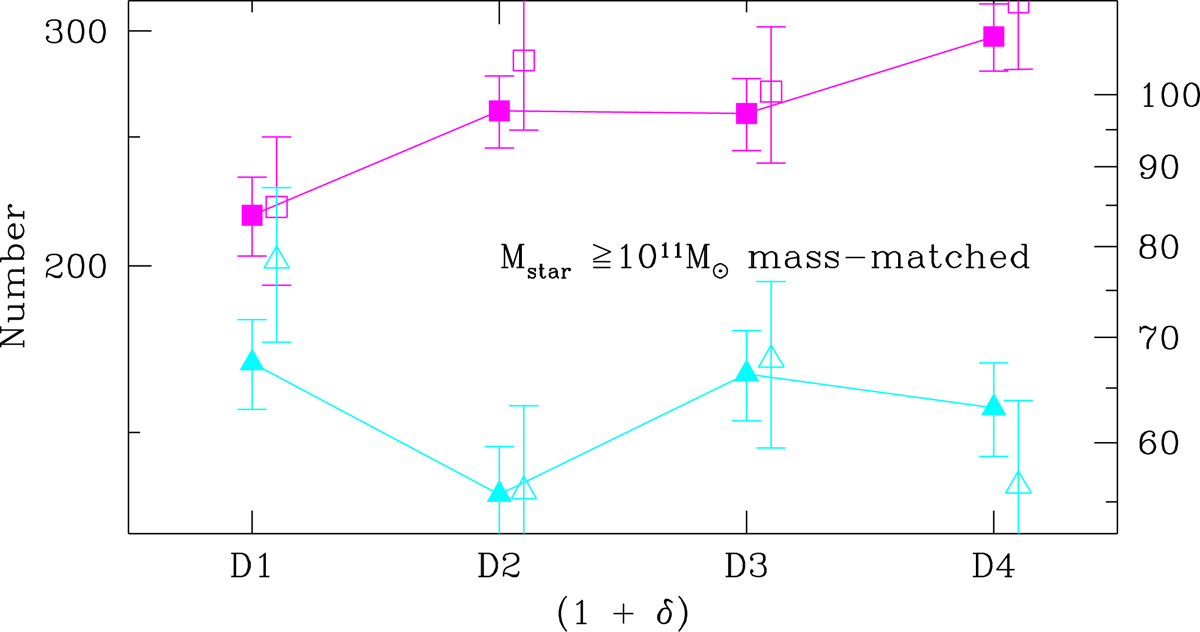
Average number of low-Σ (filled magenta squares) and high-Σ (filled cyan triangles) MPGs as a function of local density δ derived from 100 mass-matched samples. The counts are corrected for the selection function of the VIPERS survey. Error bars include the Poisson fluctuations and the error on the mean. The four δ bins correspond to the four quartiles of the MPG (1 + δ) distribution. Open symbols are the mean number of low- and high-Σ MPGs that are effectively observed (i.e., not corrected for the selection function) over 100 iterations. The ordinate scale on the right-hand side refers to the uncorrected counts.
Current usage metrics show cumulative count of Article Views (full-text article views including HTML views, PDF and ePub downloads, according to the available data) and Abstracts Views on Vision4Press platform.
Data correspond to usage on the plateform after 2015. The current usage metrics is available 48-96 hours after online publication and is updated daily on week days.
Initial download of the metrics may take a while.