Fig. 4.
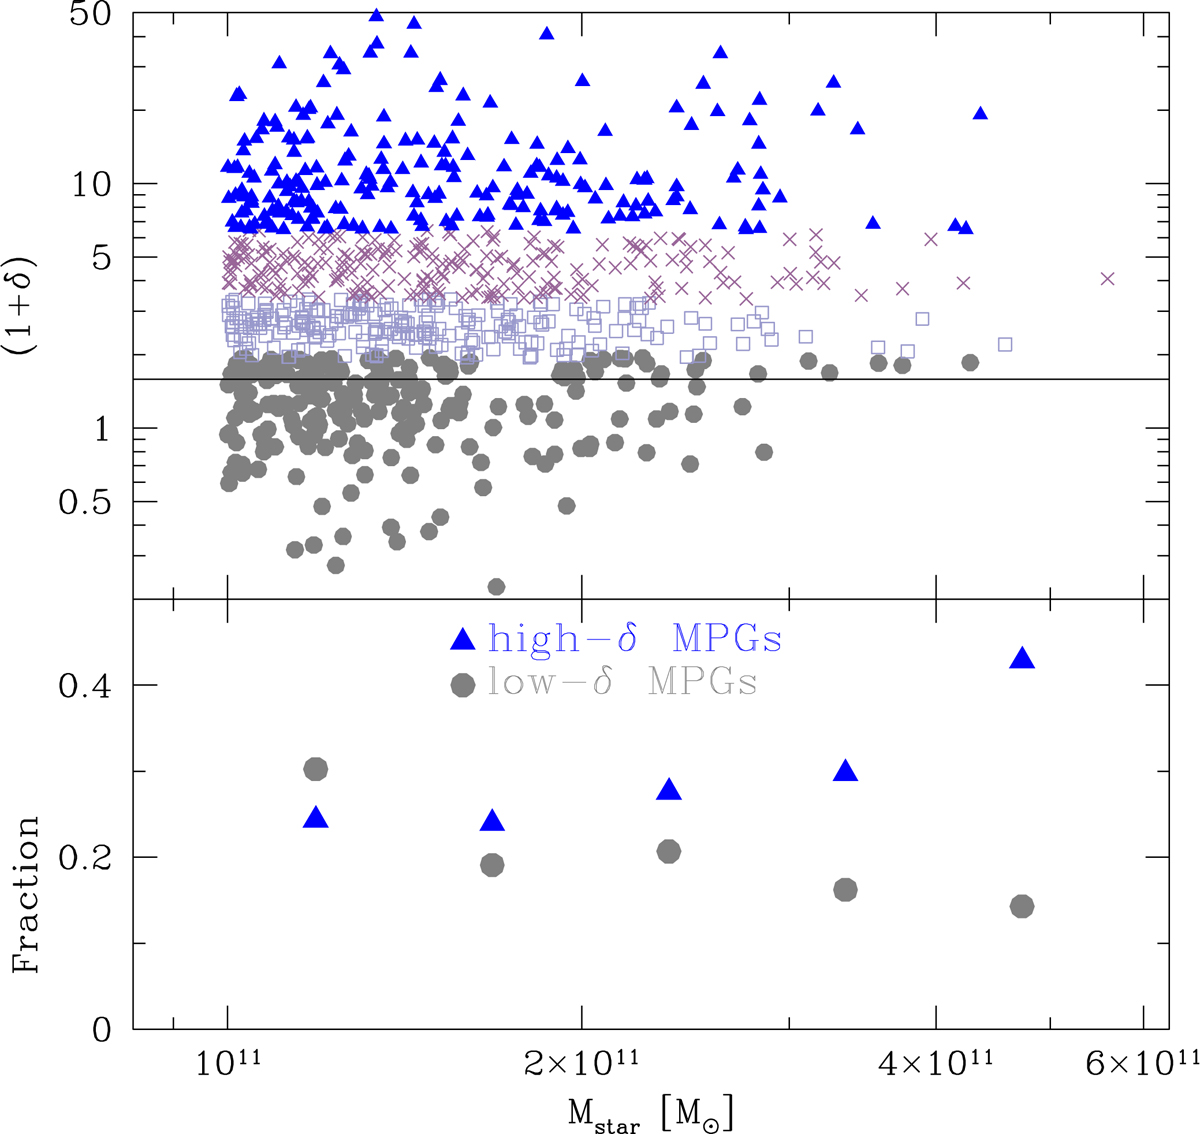
Upper panel: local density δ as a function of galaxy stellar mass for our MPG sample. Filled gray circles, open violet squares, pink crosses, and filled blue triangles indicate MPGs in the D1, D2, D3, and D4 quartiles. The horizontal solid line indicates the δ value above which MPGs cover the full range of stellar mass (1 + δ = 1.5) (see Sect. 3). Bottom panel: fraction of MPGs in the highest and lowest δ quartiles as a function of galaxy stellar mass (blue triangles and gray full circles, respectively).
Current usage metrics show cumulative count of Article Views (full-text article views including HTML views, PDF and ePub downloads, according to the available data) and Abstracts Views on Vision4Press platform.
Data correspond to usage on the plateform after 2015. The current usage metrics is available 48-96 hours after online publication and is updated daily on week days.
Initial download of the metrics may take a while.