Fig. 2.
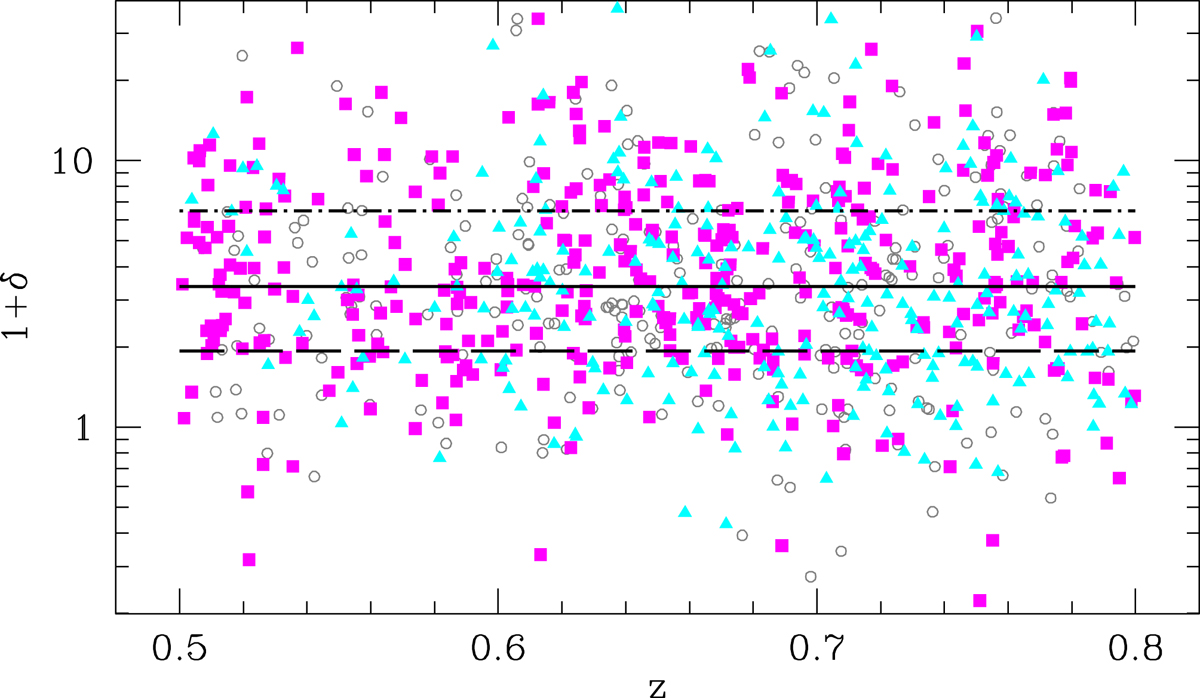
Galaxy density contrast as a function of z for the population of MPGs with reliable estimates of δ and Re (gray circles, magenta squares, or cyan triangles). Solid lines indicate the median value of the (1 + δ) distribution, while the 25th and the 75th percentiles are indicated with long-dashed and dot-dashed lines, respectively. Magenta filled squares are MPGs with Σ ≤ 1000 M⊙ pc−2 (i.e., the low-Σ sample), cyan filled triangles are MPGs with Σ > 2000 M⊙ pc−2 (i.e., the high-Σ sample) and gray circles are MPGs with 1000 < Σ ≤ 2000 M⊙ pc−2.
Current usage metrics show cumulative count of Article Views (full-text article views including HTML views, PDF and ePub downloads, according to the available data) and Abstracts Views on Vision4Press platform.
Data correspond to usage on the plateform after 2015. The current usage metrics is available 48-96 hours after online publication and is updated daily on week days.
Initial download of the metrics may take a while.