Fig. D.1.
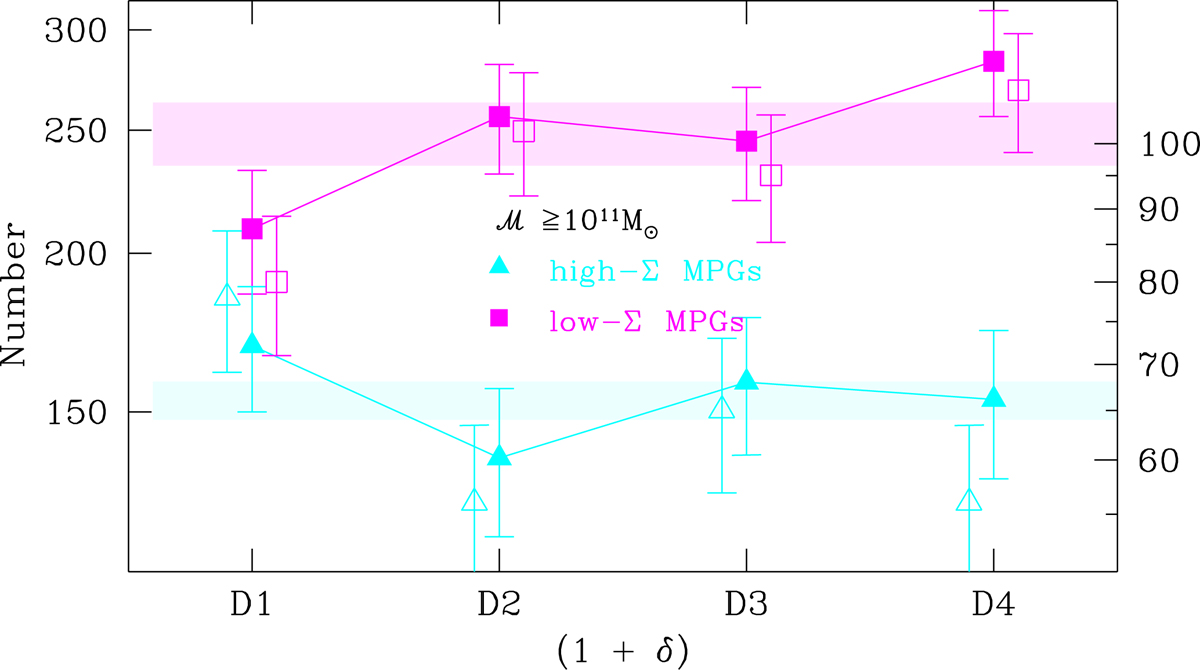
Same as Fig. 5, but now the filled magenta and cyan symbols show the number of low-Σ and high-Σ MPGs corrected for the selection function of the VIPERS survey. Error bars take the Poisson fluctuations into account. Open symbols show the number of low- and high-Σ MPGs that are effectively observed (i.e., not corrected for the selection function).
Current usage metrics show cumulative count of Article Views (full-text article views including HTML views, PDF and ePub downloads, according to the available data) and Abstracts Views on Vision4Press platform.
Data correspond to usage on the plateform after 2015. The current usage metrics is available 48-96 hours after online publication and is updated daily on week days.
Initial download of the metrics may take a while.