Fig. 3.
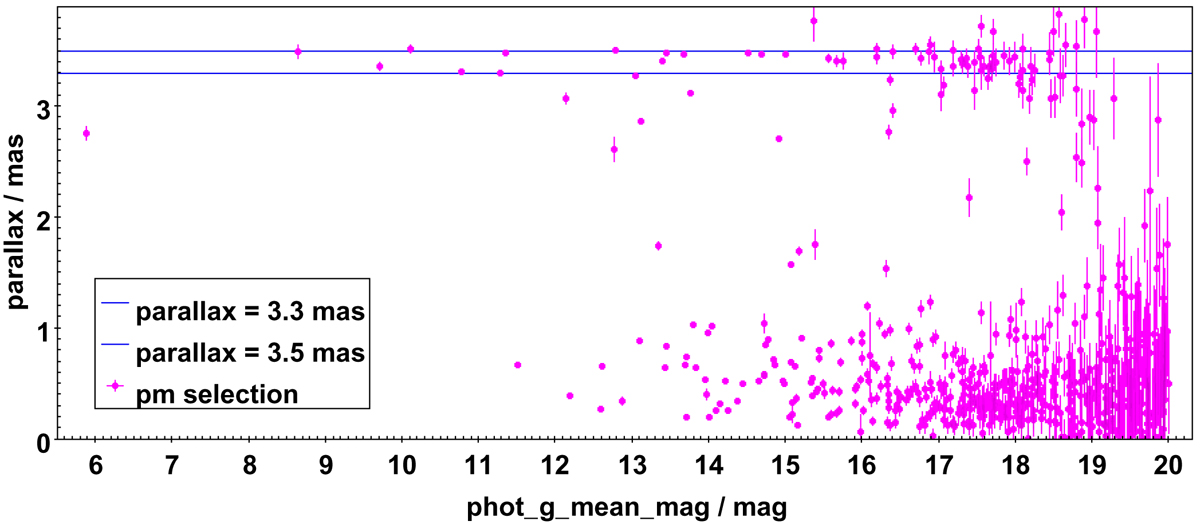
Gaia DR2 parallaxes of the star sample in Fig. 2, independently confirming the cluster nature of the photometric discovery made in view of Fig. 2. The horizontal axis is the Gaia DR2 G magnitude; axes are labelled with the names of the relevant quantities in the public Gaia DR2 tables; units are indicated. The pink bars indicate the standard errors of the parallaxes, as given in DR2.
Current usage metrics show cumulative count of Article Views (full-text article views including HTML views, PDF and ePub downloads, according to the available data) and Abstracts Views on Vision4Press platform.
Data correspond to usage on the plateform after 2015. The current usage metrics is available 48-96 hours after online publication and is updated daily on week days.
Initial download of the metrics may take a while.