Free Access
Fig. E.1.
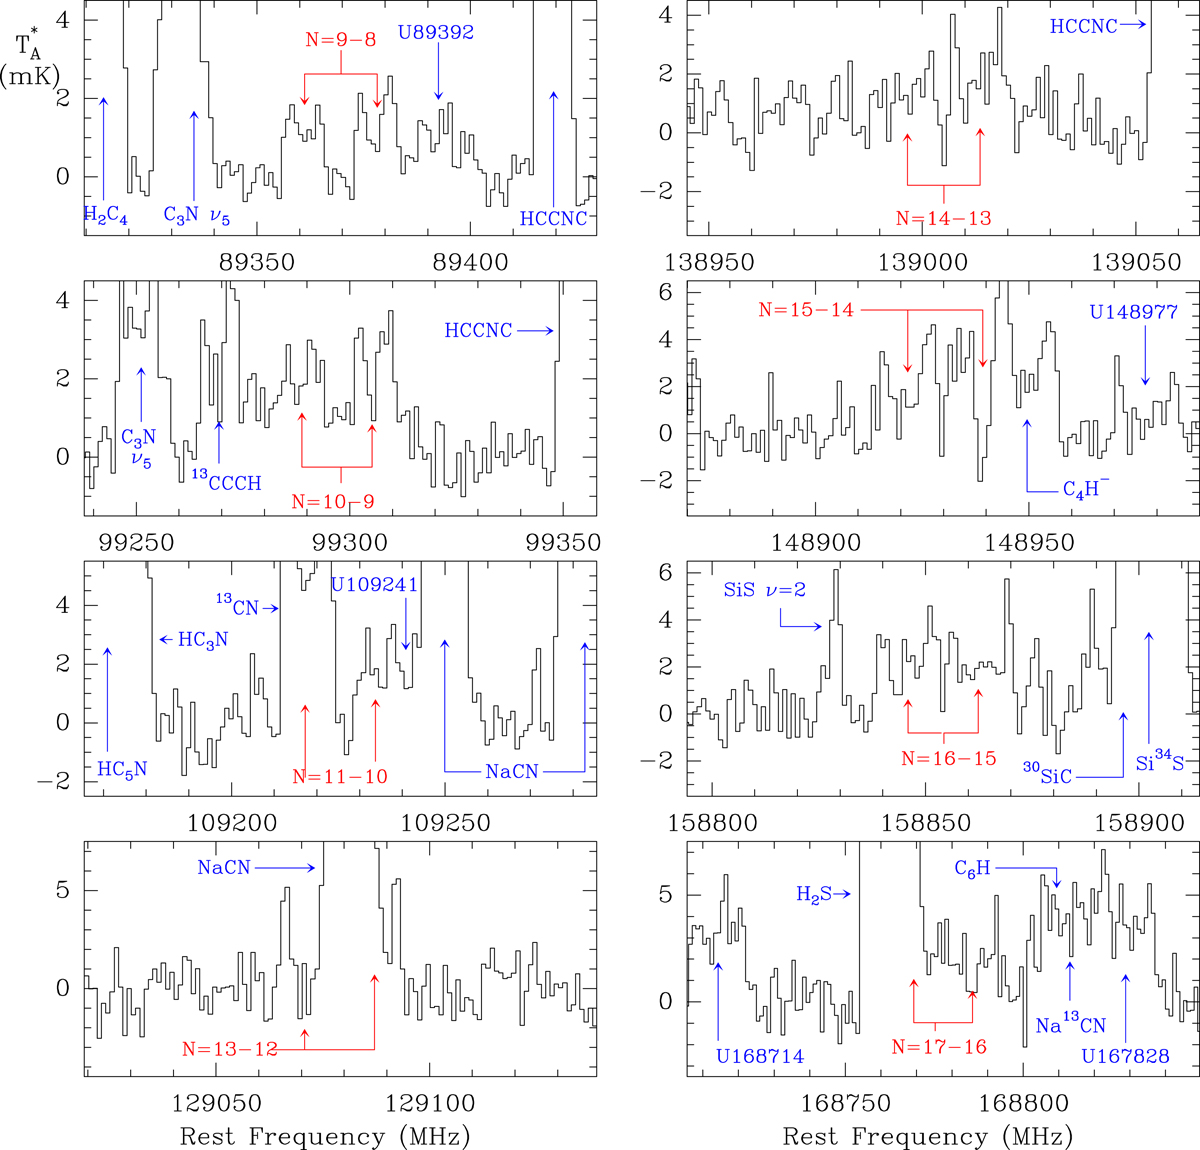
Observed doublets of MgCCH towards IRC+10216 (black histogram). The vertical scale is the antenna temperature in mK, and the horizontal scale is the frequency in MHz. Labels for the lines of MgCCH are plotted in red in each panel. Unidentified (U) lines are indicated in blue.
Current usage metrics show cumulative count of Article Views (full-text article views including HTML views, PDF and ePub downloads, according to the available data) and Abstracts Views on Vision4Press platform.
Data correspond to usage on the plateform after 2015. The current usage metrics is available 48-96 hours after online publication and is updated daily on week days.
Initial download of the metrics may take a while.