Fig. 1.
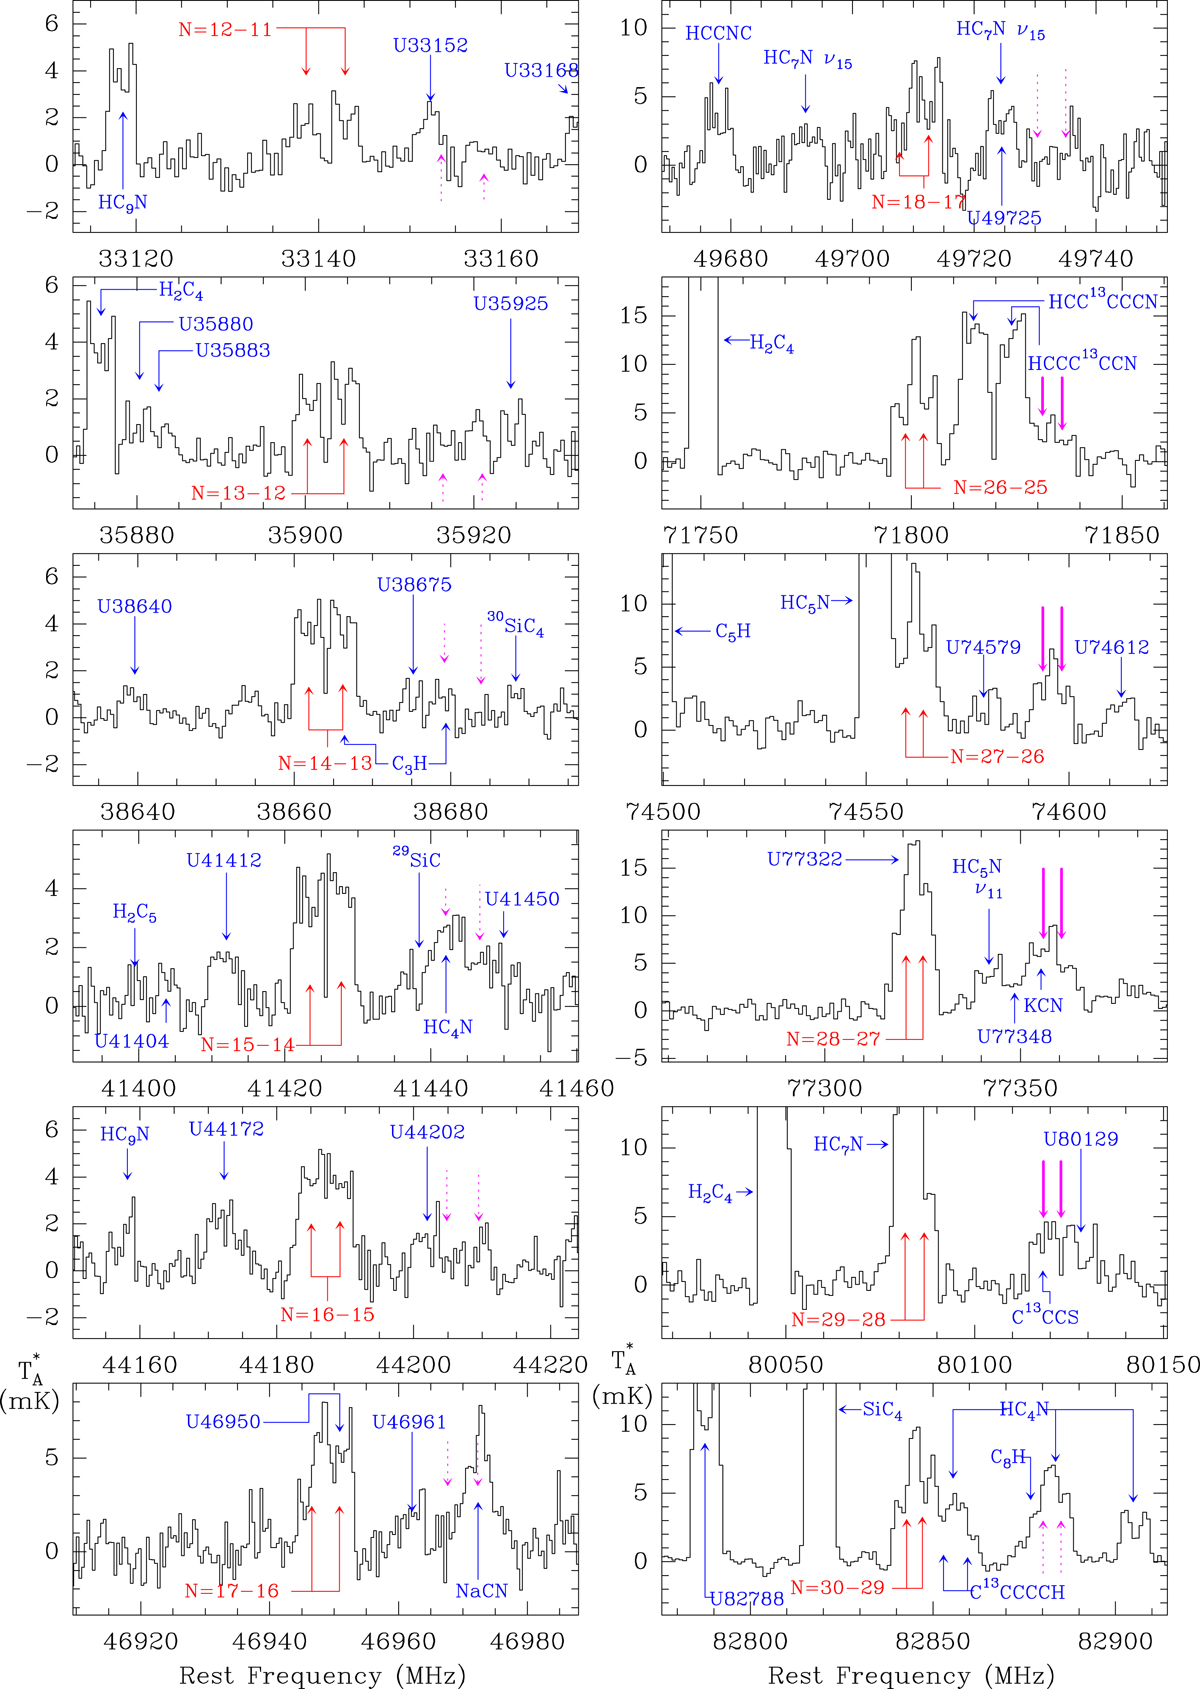
Observed doublets towards IRC+10216 (black histogram). The vertical scale is the antenna temperature in mK and the horizontal scale is the rest frequency in MHz. Shown are the lines of the series of doublets S 1 (labelled in red) and those of series S 2, with the same quantum numbers as S 1 (in magenta); unidentified (U) lines and lines arising from other species are also shown (in blue). When lines of the S 2 series are blended with other features, or are too weak to be detected (those below 50 GHz), their positions are indicated by dashed arrows.
Current usage metrics show cumulative count of Article Views (full-text article views including HTML views, PDF and ePub downloads, according to the available data) and Abstracts Views on Vision4Press platform.
Data correspond to usage on the plateform after 2015. The current usage metrics is available 48-96 hours after online publication and is updated daily on week days.
Initial download of the metrics may take a while.