Fig. 3
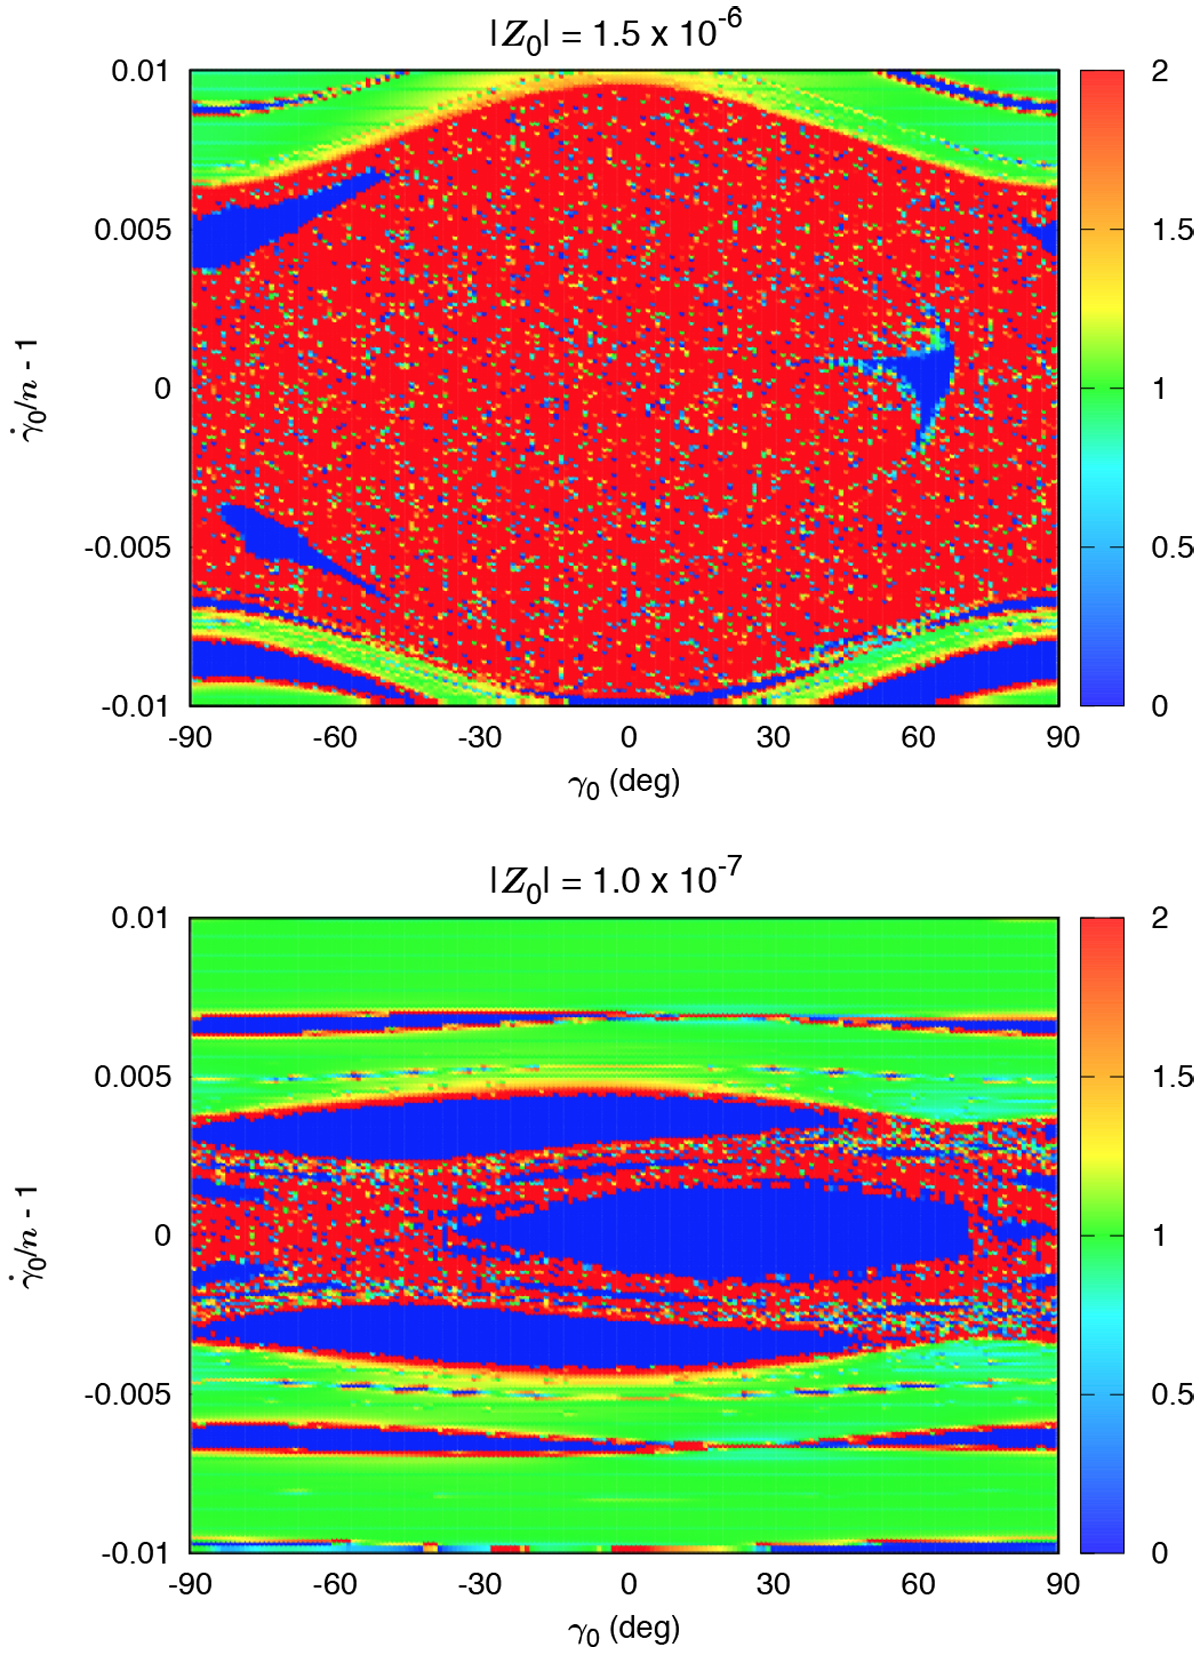
Frequency map analysis of KOI-1599 outer planet rotation angle assuming a rigid body with |Z0 | = 1.5 × 10⁻⁶ (top) or |Z0| = 1.0 × 10⁻⁷
(bottom). Each dot corresponds to a grid with 181 × 201 different initial conditions of γ(0) and ![]() , respectively, with γ(t) = θ(t) − λ(0). The color index gives the derivative
, respectively, with γ(t) = θ(t) − λ(0). The color index gives the derivative ![]() , where η
is the main frequency of γ(t). The blue dots correspond to resonant motion, green dots to nonresonant regular motion, and red dots to chaotic motion.
, where η
is the main frequency of γ(t). The blue dots correspond to resonant motion, green dots to nonresonant regular motion, and red dots to chaotic motion.
Current usage metrics show cumulative count of Article Views (full-text article views including HTML views, PDF and ePub downloads, according to the available data) and Abstracts Views on Vision4Press platform.
Data correspond to usage on the plateform after 2015. The current usage metrics is available 48-96 hours after online publication and is updated daily on week days.
Initial download of the metrics may take a while.