Fig. 2.
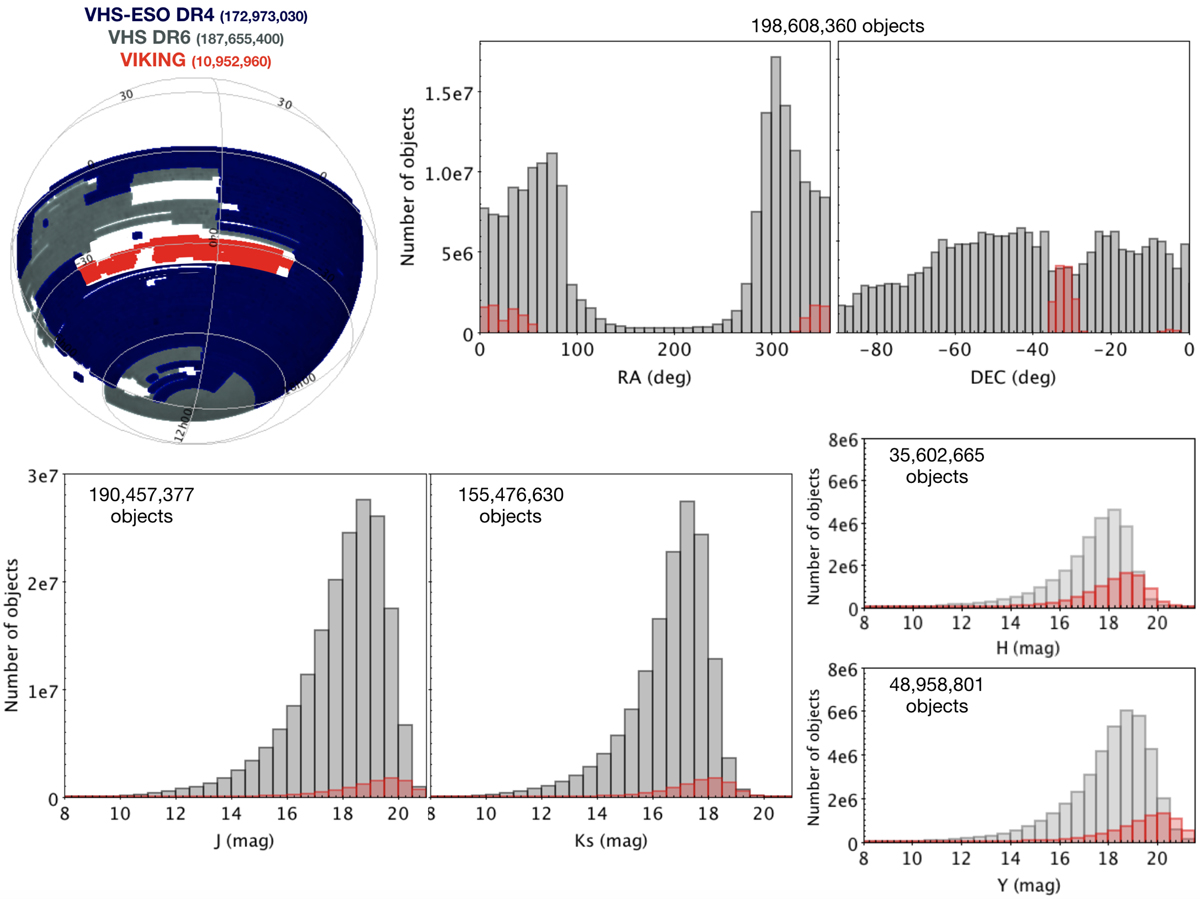
Left: sky view of the VISTA footprint (VHS in grey and VIKING in red) compared to the VHS-ESO DR4 (blue). Right: histograms of RA and Dec for the VISTA Surveys that we used for this VEXAS-DR1. The total number of objects in the catalogue is shown above each histogram. Bottom: distribution of Ks, J, H, and Y magnitudes of the input VISTA table, with number of objects within the magnitude ranges of Eq. (1) given in the top left corner of each panel. The VSH has a very broad coverage in J and Ks, but only observed H and Y in a few fields.
Current usage metrics show cumulative count of Article Views (full-text article views including HTML views, PDF and ePub downloads, according to the available data) and Abstracts Views on Vision4Press platform.
Data correspond to usage on the plateform after 2015. The current usage metrics is available 48-96 hours after online publication and is updated daily on week days.
Initial download of the metrics may take a while.