Fig. 3.
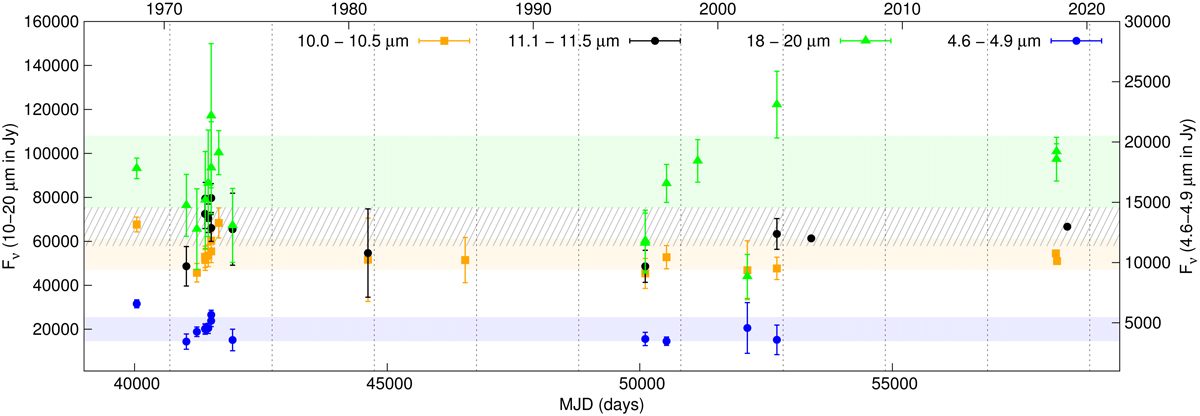
Time evolution of the mid-IR flux of the Homunculus nebula around η Car from 1968 to 2018 in four wavelength regions, chosen for best temporal coverage. Vertical dashed lines indicate periastron passages. The 1σ region of the average flux for each wavelength region is shown (averages exclude the lower ISO flux values). There is no evidence for a long-term change, but variations with the orbital period cannot be ruled out.
Current usage metrics show cumulative count of Article Views (full-text article views including HTML views, PDF and ePub downloads, according to the available data) and Abstracts Views on Vision4Press platform.
Data correspond to usage on the plateform after 2015. The current usage metrics is available 48-96 hours after online publication and is updated daily on week days.
Initial download of the metrics may take a while.