Fig. 6.
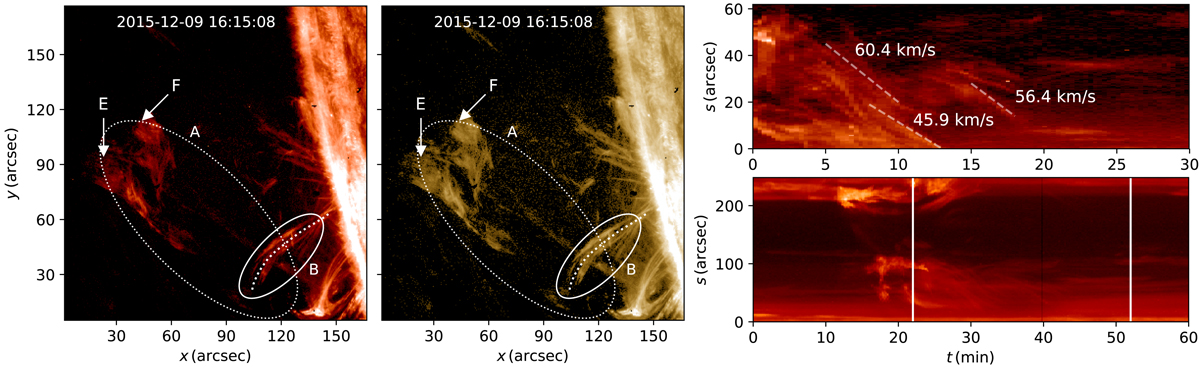
IRIS SJI data in Si IV (left) and Mg II K (middle) showing coronal rain condensation formed due to reconnection-induced heating. The surge (A) and the thermally unstable coronal loop with coronal rain (B) are both visible. Also visible are the freely moving (E) and confined surge components (F). The motion of the coronal rain along the loop is shown in the time-distance plot (top right) taken along the dotted line shown in SJI snapshots. The y-axis corresponds to the distance along the loop. Trajectories of three coronal rain condensations with corresponding average speeds are outlined by dashed lines as an example. The evolution along the whole loop in AIA 304 Å shows coronal rain falling down along both loop legs (bottom right). The vertical solid lines in the AIA 304 Å time-distance plot mark the beginning and end of the IRIS observing sequence.
Current usage metrics show cumulative count of Article Views (full-text article views including HTML views, PDF and ePub downloads, according to the available data) and Abstracts Views on Vision4Press platform.
Data correspond to usage on the plateform after 2015. The current usage metrics is available 48-96 hours after online publication and is updated daily on week days.
Initial download of the metrics may take a while.