Fig. 5.
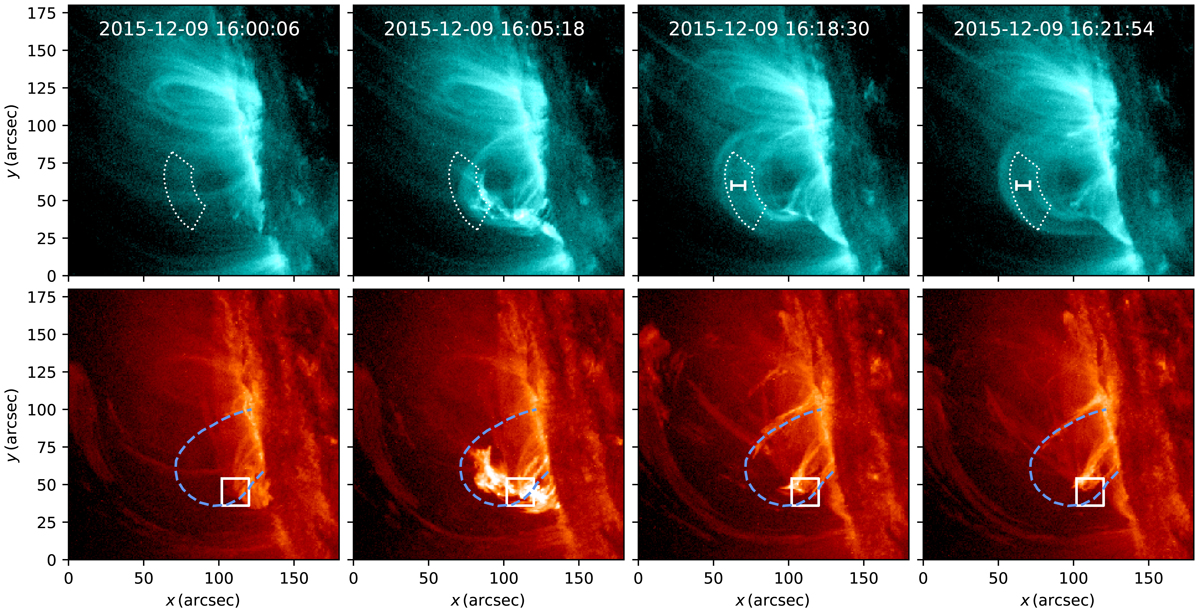
Evidence of catastrophic cooling in the studied loop. We plot the snapshots of the loop evolution in the hotter 131 Å channel (top) and cooler 304 Å channel (bottom). The snapshots correspond to the loop not being visible before the reconnection event, to the heating of the loop immediately following the reconnection, the dimming of the central part of the loop in the coronal wavelengths and the coronal rain formation along that field line and to final stage corresponding to the evacuation of the loop following the coronal rain shower (left to right). The dotted line outlines the position of the loop top. The white horizontal bar in the 131 Å snapshot shows the evacuated loop bundle that became thermally unstable. The solid square indicates the location of the reconnection site. The blue dashed line shows the axis of the coronal loop bundle that becomes thermally unstable.
Current usage metrics show cumulative count of Article Views (full-text article views including HTML views, PDF and ePub downloads, according to the available data) and Abstracts Views on Vision4Press platform.
Data correspond to usage on the plateform after 2015. The current usage metrics is available 48-96 hours after online publication and is updated daily on week days.
Initial download of the metrics may take a while.