Fig. 3.
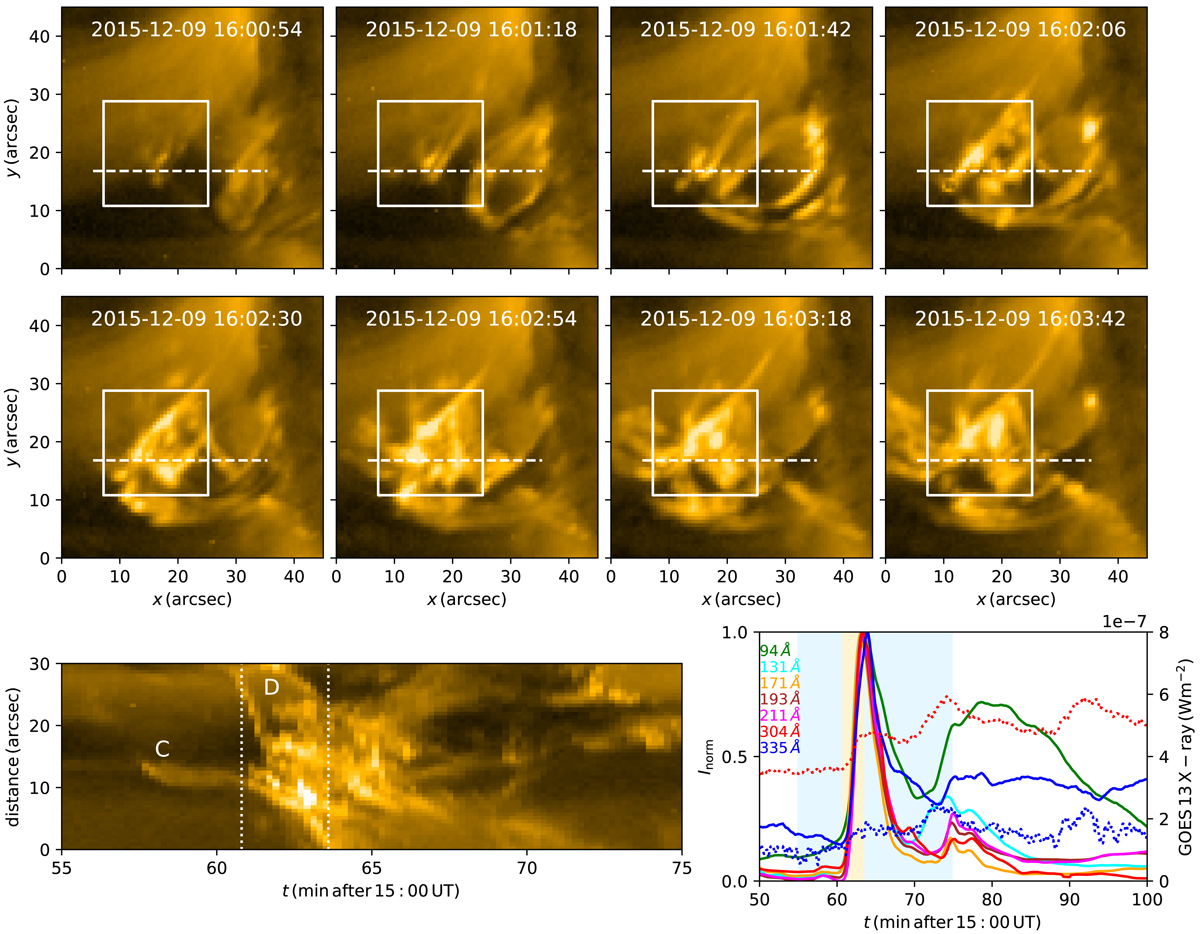
Top: snapshots taken from AIA 171 data covering the time interval 2015-12-09 16:00:54 – 2015-12-09 16:03:42 during which the reconnection occurs zoomed on the reconnection region. The white square marks the reconnection region over which the emission intensities are integrated. Bottom left: distance–time plot of the approaching low-lying loop-like structures seen in AIA 171. The y-axis corresponds to distance along the horizontal dashed line shown in the snapshots above; the x-axis corresponds to time. The paths of individual structures C and D are indicated in the distance–time plot. Vertical dotted lines give the time range covered by snapshots above. Bottom right: solid lines show the evolution of normalised emission intensities in individual AIA bandpasses integrated over reconnection region. Red and blue dotted lines correspond to the evolution of solar X-ray irradiance as measured by GOES 13 in the XRS long-wavelength channel (0.1−0.8 nm), and in the XRS short-wavelength channel (0.05−0.4 nm), respectively. The short-wavelength irradiance has been multiplied by a factor of 10 to improve clarity. The blue shaded region corresponds to the time range shown in the distance–time plot on the left. The yellow shaded region corresponds to the time range covered by the snapshots above. The duration of the impulsive phase associated with the reconnection corresponding to the increasing emission in all AIA channels is ∼3 min.
Current usage metrics show cumulative count of Article Views (full-text article views including HTML views, PDF and ePub downloads, according to the available data) and Abstracts Views on Vision4Press platform.
Data correspond to usage on the plateform after 2015. The current usage metrics is available 48-96 hours after online publication and is updated daily on week days.
Initial download of the metrics may take a while.