Fig. 2.
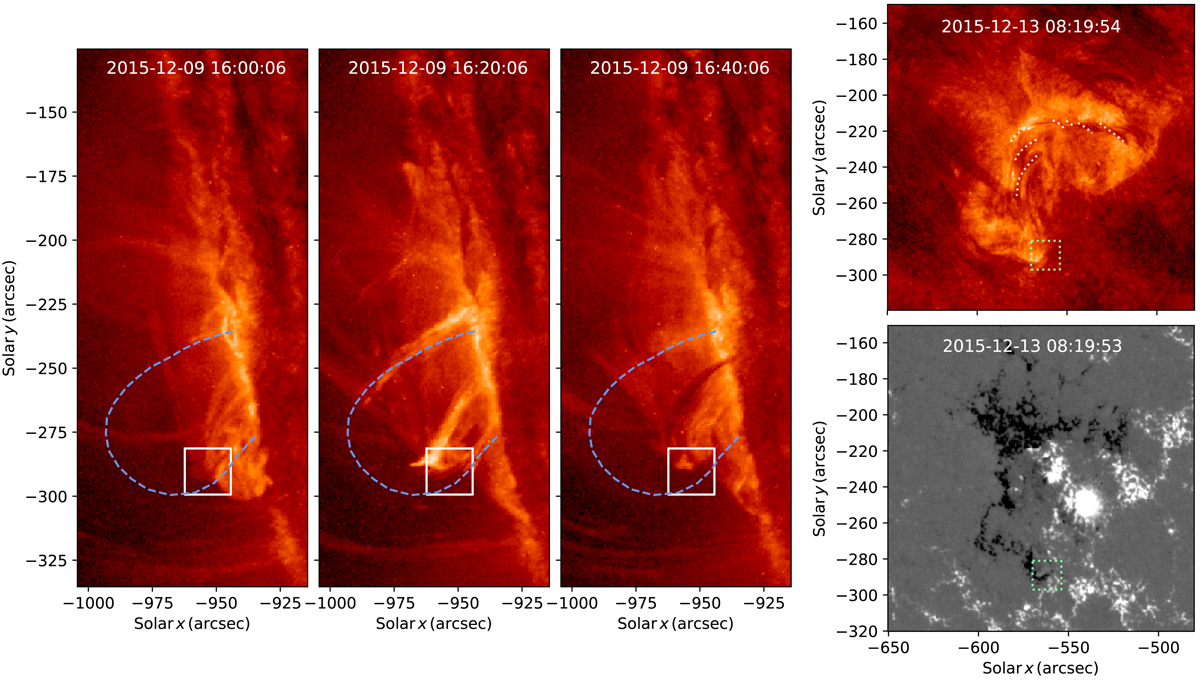
Left to right: AIA 304 Å snapshots showing the prominence at the limb immediately before the reconnection occurring at 16:02 UT, shortly after, and in a new quasi-steady state. The solid square indicates the location of the reconnection site. The blue dashed line outlines the axes of the coronal loop bundle that becomes thermally unstable. After a few days, the prominence is still visible on-disc as a filament (top right). The white dotted lines outline the filament turns. The HMI magnetogram (bottom right) shows that the flux rope lies along a polarity inversion line with one leg embedded in a flux cancellation region (green dotted square).
Current usage metrics show cumulative count of Article Views (full-text article views including HTML views, PDF and ePub downloads, according to the available data) and Abstracts Views on Vision4Press platform.
Data correspond to usage on the plateform after 2015. The current usage metrics is available 48-96 hours after online publication and is updated daily on week days.
Initial download of the metrics may take a while.