Fig. 1.
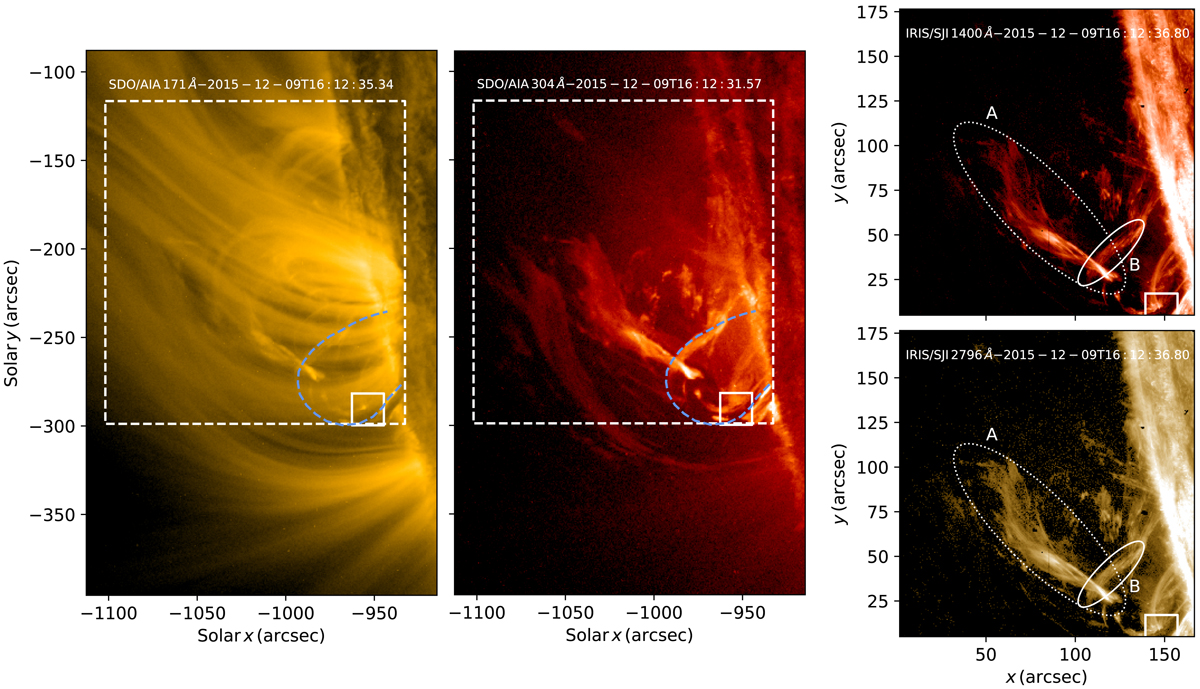
Snapshots of the studied active region observed at 16:12:35 in AIA 171 Å (left), AIA 304 Å (middle) and IRIS SJI 1400 Å (top right) and 2796 Å (bottom right), with the dashed line in the AIA images outlining the IRIS FOV. The snapshots show untwisting surge material (A), coronal rain condensations forming in the thermally unstable loop (B), and the active region prominence observed at the limb. The blue dashed line outlines the axis of the coronal loop bundle that turns thermally unstable after the reconnection. The solid square indicates the reconnection region near one of the prominence legs. Animation of this figure is available online.
Current usage metrics show cumulative count of Article Views (full-text article views including HTML views, PDF and ePub downloads, according to the available data) and Abstracts Views on Vision4Press platform.
Data correspond to usage on the plateform after 2015. The current usage metrics is available 48-96 hours after online publication and is updated daily on week days.
Initial download of the metrics may take a while.