Fig. 6.
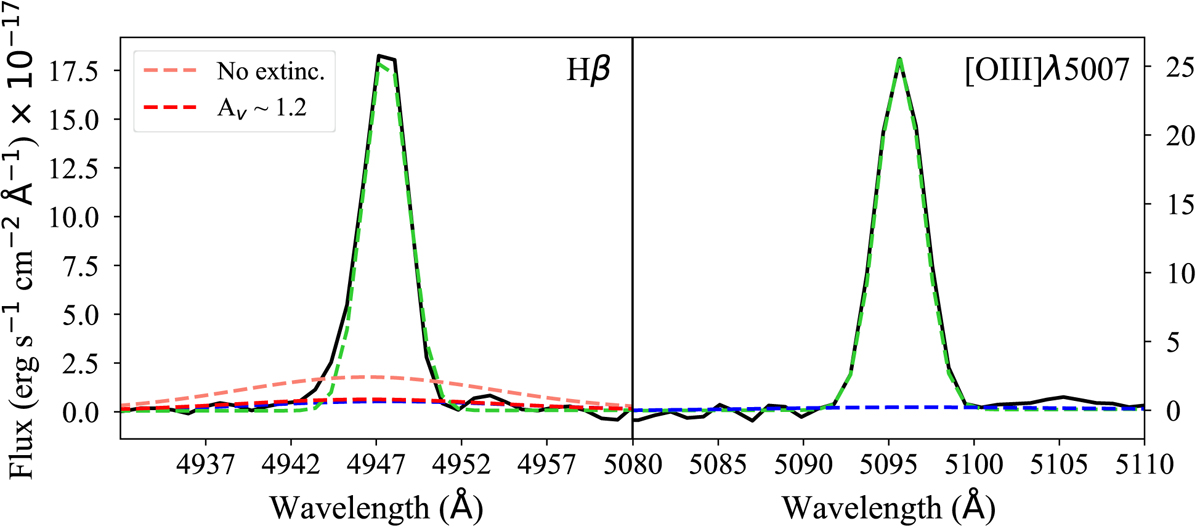
MaNGA spectrum of the HII region around the Hβ (left) and [O III] (right) lines, with the result from the spectral fit (blue and green dashed lines) fixing the kinematics to those found in Hα. In the left panel we also show the expected Hβ profile for a case with no extinction (light red) and one with AV ∼ 1.2 (dark red), indicating that a moderate extinction could prevent the detection of the broad component in Hβ.
Current usage metrics show cumulative count of Article Views (full-text article views including HTML views, PDF and ePub downloads, according to the available data) and Abstracts Views on Vision4Press platform.
Data correspond to usage on the plateform after 2015. The current usage metrics is available 48-96 hours after online publication and is updated daily on week days.
Initial download of the metrics may take a while.