Fig. 5.
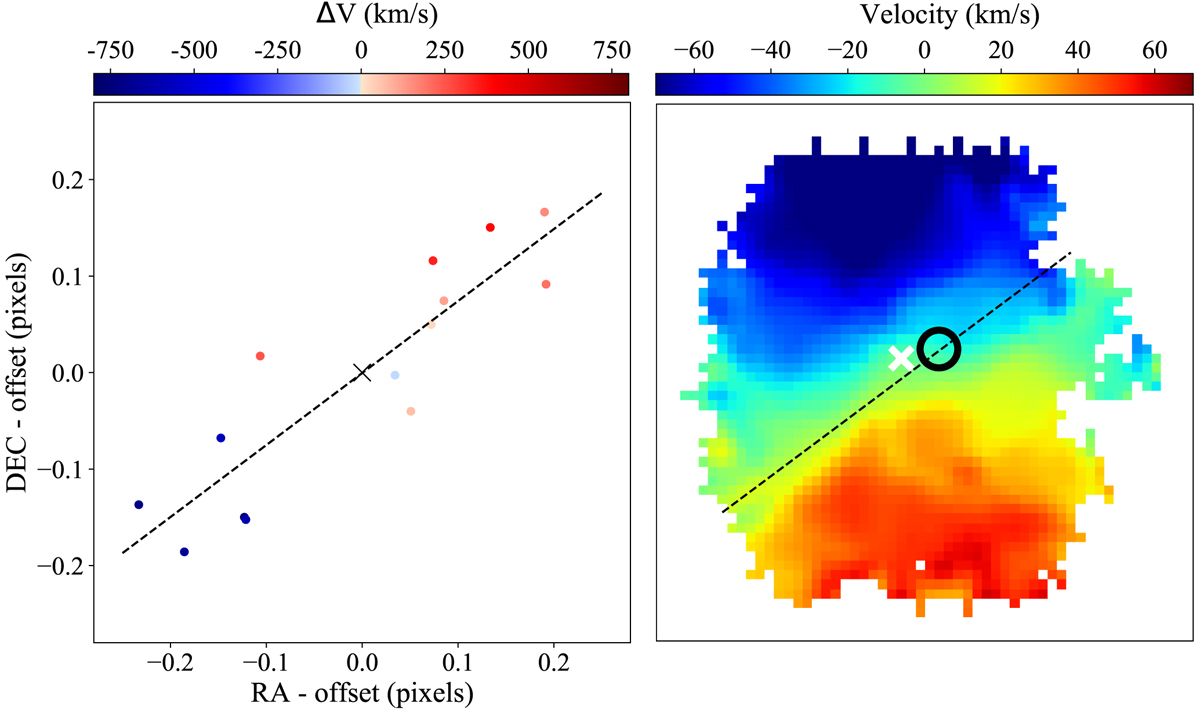
Left: positions of the centroid of emission at different velocities (wavelengths) around the HII region in the MaNGA data. The different spatial location of the receding (red) and preceding (blue) light indicate that the emission is spatially resolved, corresponding to a size of ∼90 pc. The black cross indicates the centroid of emission at the wavelength of reference, 6685 Å (ΔV = 0). Right: velocity field of galaxy SDSS J143245.98+404300.3. The black circle marks the location of the HII region. The dashed line corresponds to the orientation of the high-velocity gas, as determined in the left panel. As in Fig. 1 the white cross marks the photometric center of the galaxy.
Current usage metrics show cumulative count of Article Views (full-text article views including HTML views, PDF and ePub downloads, according to the available data) and Abstracts Views on Vision4Press platform.
Data correspond to usage on the plateform after 2015. The current usage metrics is available 48-96 hours after online publication and is updated daily on week days.
Initial download of the metrics may take a while.