Fig. 4.
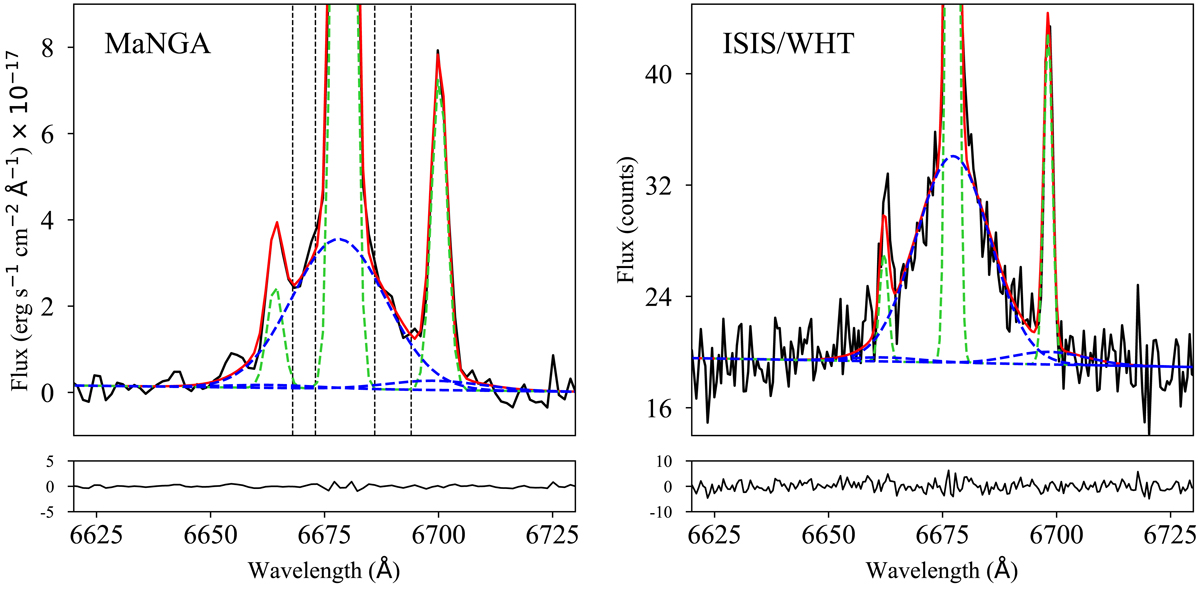
Modeling of the MaNGA and ISIS/WHT spectra from the off-nuclear HII region identified in SDSS J143245.98+404300.3. Black solid lines represent the observed data. Green and blue dashed lines correspond to the narrow and broad components, respectively, and the red solid line is the sum of these two. The dashed vertical lines mark the wavelength ranges that are used to study the spatial extent of the broad emission in the MaNGA data (see Sect. 2.3).
Current usage metrics show cumulative count of Article Views (full-text article views including HTML views, PDF and ePub downloads, according to the available data) and Abstracts Views on Vision4Press platform.
Data correspond to usage on the plateform after 2015. The current usage metrics is available 48-96 hours after online publication and is updated daily on week days.
Initial download of the metrics may take a while.