Fig. 3.
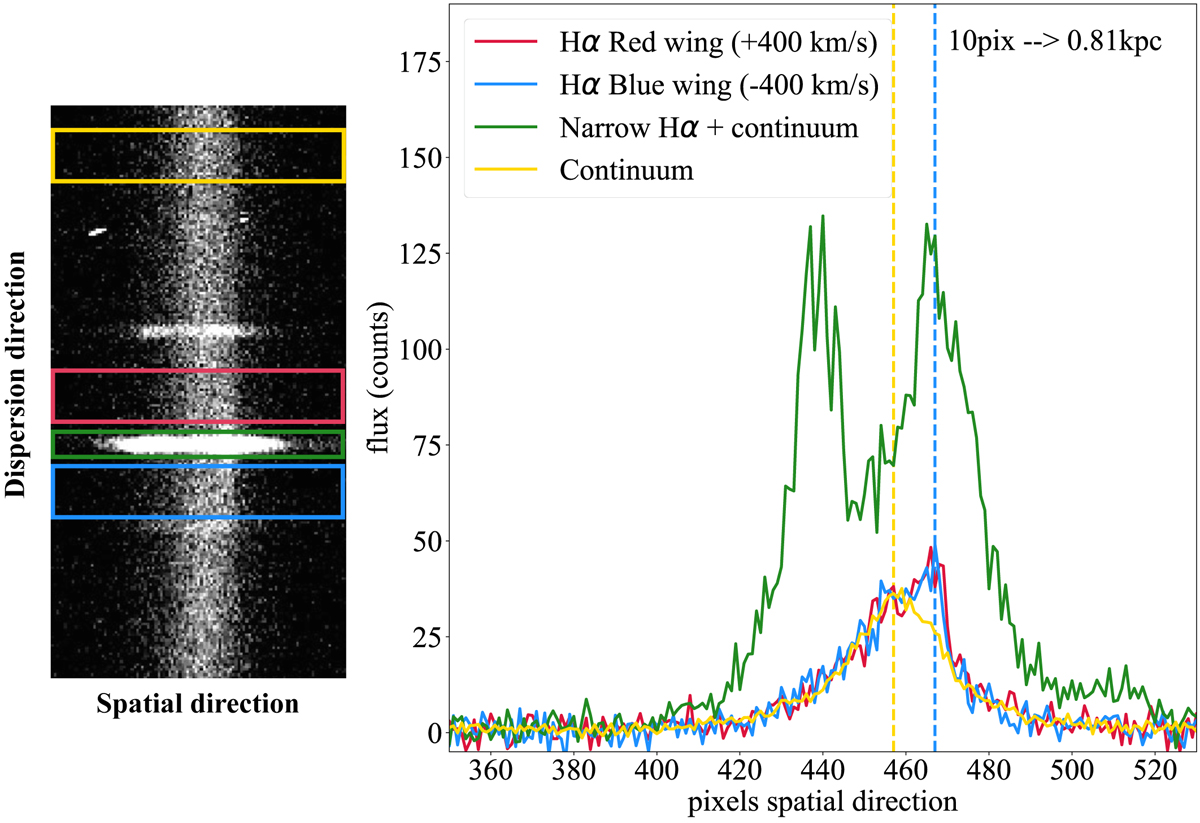
Left: example of a 2D reduced image from the ISIS/WHT data obtained with the slit in the PA1 orientation. The colored regions are chosen to contain the light from the narrow component of Hα (green), the continuum emission (yellow), and the gas at velocities of −400 km s−1 (blue) and +400 km s−1 (red) with respect to the narrow component of Hα (systemic). Right: median light distribution for each of the regions selected in the left image. The vertical dashed lines mark the positions of the peaks of emission in the continuum and at ±400 km s−1 with respect to the systemic emission.
Current usage metrics show cumulative count of Article Views (full-text article views including HTML views, PDF and ePub downloads, according to the available data) and Abstracts Views on Vision4Press platform.
Data correspond to usage on the plateform after 2015. The current usage metrics is available 48-96 hours after online publication and is updated daily on week days.
Initial download of the metrics may take a while.