Fig. 1.
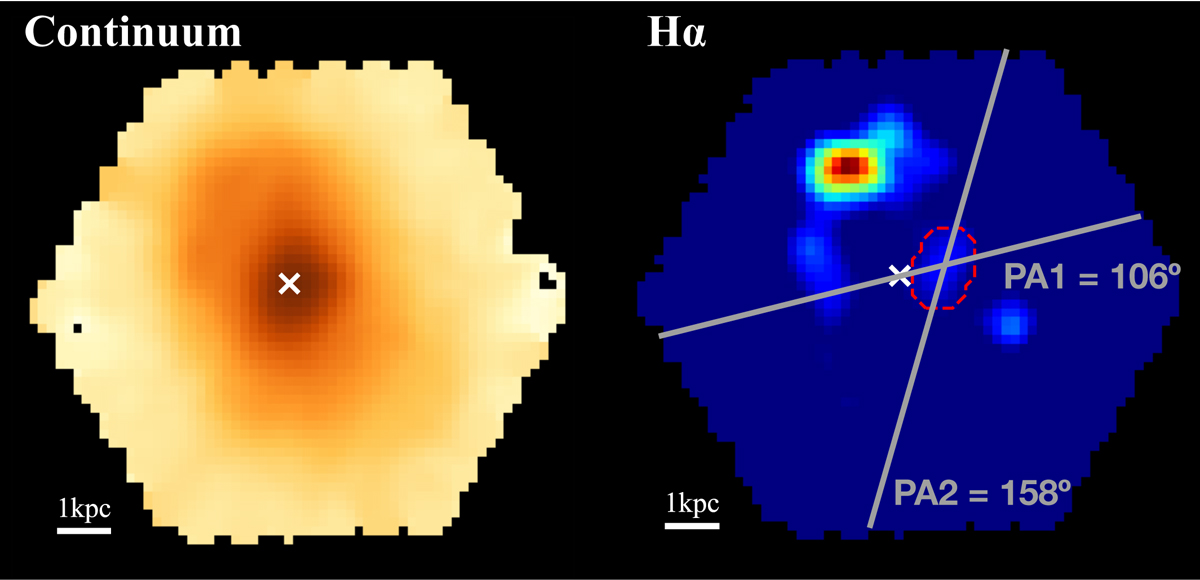
Continuum (left) and Hα (right) emission maps of SDSS J143245.98+404300.3 obtained from the MaNGA data. The red dashed line highlights the position of the off-nuclear HII region where the high-velocity gas component has been found. The white cross indicates the photometric center of the galaxy. We have also highlighted in gray the two positions used for the long-slit spectroscopic observations with ISIS/WHT.
Current usage metrics show cumulative count of Article Views (full-text article views including HTML views, PDF and ePub downloads, according to the available data) and Abstracts Views on Vision4Press platform.
Data correspond to usage on the plateform after 2015. The current usage metrics is available 48-96 hours after online publication and is updated daily on week days.
Initial download of the metrics may take a while.