Fig. 7.
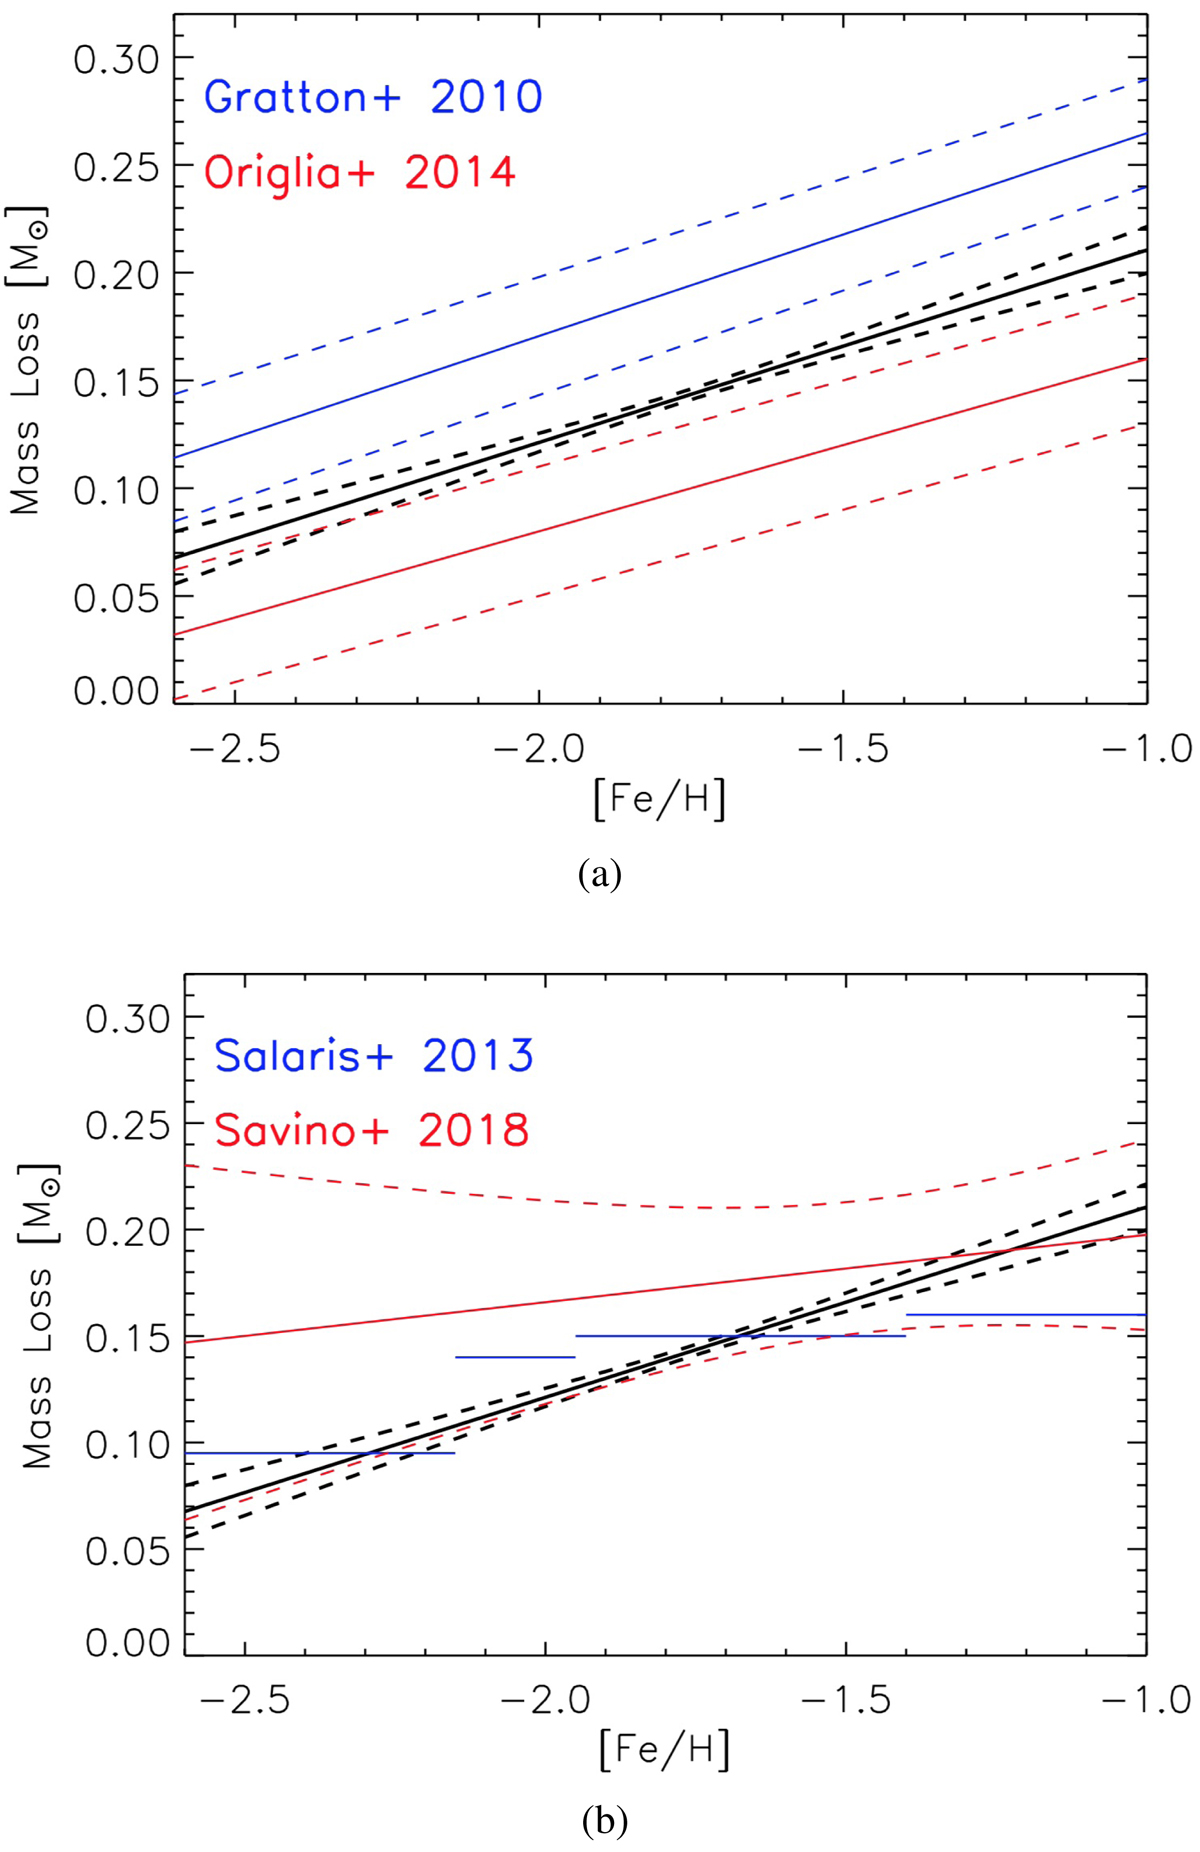
Total RGB mass loss as a function of metallicity, as measured from our modelling. The black solid line shows our measurements and the dashed black lines mark the one sigma confidence interval. Panel a: comparison with measurements obtained, on globular clusters, by Gratton et al. (2010) (blue), Origlia et al. (2014) (red). Panel b: comparison with measurements obtained, on the Sculptor dSph, by Salaris et al. (2013) (blue) and Savino et al. (2018) (red).
Current usage metrics show cumulative count of Article Views (full-text article views including HTML views, PDF and ePub downloads, according to the available data) and Abstracts Views on Vision4Press platform.
Data correspond to usage on the plateform after 2015. The current usage metrics is available 48-96 hours after online publication and is updated daily on week days.
Initial download of the metrics may take a while.