Fig. A.3.
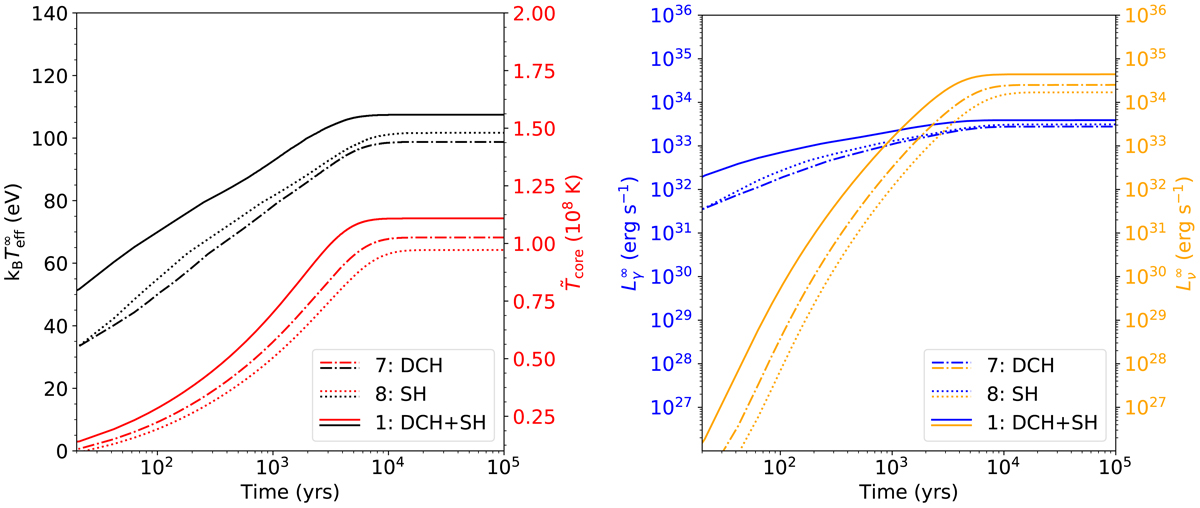
Same as Fig. A.1, but comparing the individual contribution of the shallow heating and deep crustal heating to that of the basic model. The solid line shows model 1, in which both deep crustal heating and shallow heating are assumed to be active. The dashed-dotted curves show the results of model 7, in which only deep crustal heating is assumed to be active (and shallow heating is inactive), and the dotted curves represent model 8, in which deep crustal heating is deactivated and only the shallow heating process takes place.
Current usage metrics show cumulative count of Article Views (full-text article views including HTML views, PDF and ePub downloads, according to the available data) and Abstracts Views on Vision4Press platform.
Data correspond to usage on the plateform after 2015. The current usage metrics is available 48-96 hours after online publication and is updated daily on week days.
Initial download of the metrics may take a while.