Fig. A.2.
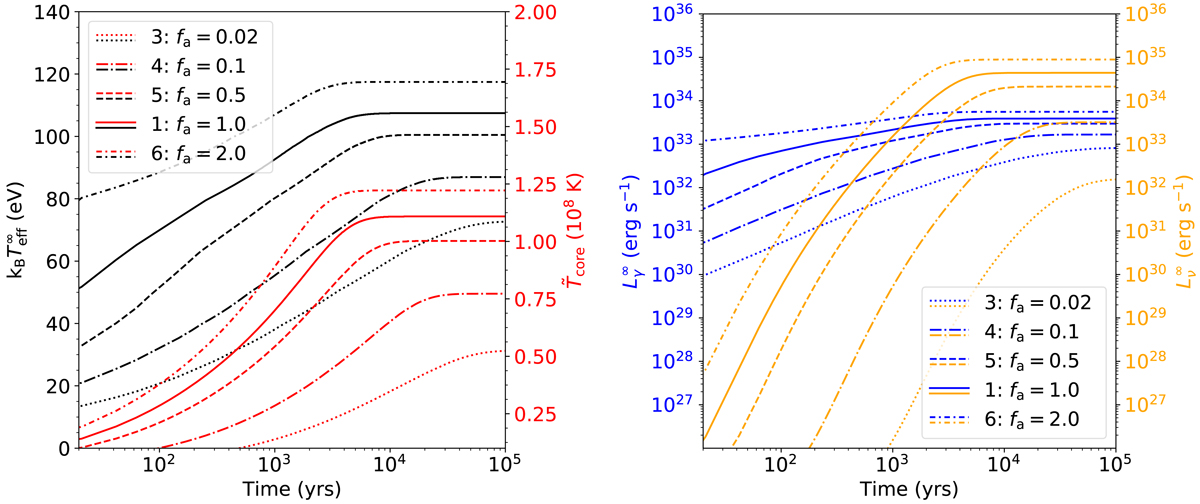
Same as Fig. A.1, but for variation in average outburst accretion rate. For the models shows in this figure, the outburst accretion rate (Ṁo), is multiplied by a factor of fa. The solid lines are for model 1 (which has a time-averaged accretion rate ⟨Ṁ⟩ = 3.2 × 10⁻¹⁰ M⊙ yr−1), the dotted line for model 3 (⟨Ṁ⟩ = 6.4 × 10⁻¹² M⊙ yr−1), the dashed-dotted line for model 4 (⟨Ṁ⟩ = 3.2 × 10⁻¹¹ M⊙ yr−1), the dashed lines for model 5 (⟨Ṁ⟩ = 1.6 × 10⁻¹⁰ M⊙ yr−1), and the short dashed-dotted curves for model 6 (⟨Ṁ⟩ = 6.4 × 10⁻¹⁰ M⊙ yr−1).
Current usage metrics show cumulative count of Article Views (full-text article views including HTML views, PDF and ePub downloads, according to the available data) and Abstracts Views on Vision4Press platform.
Data correspond to usage on the plateform after 2015. The current usage metrics is available 48-96 hours after online publication and is updated daily on week days.
Initial download of the metrics may take a while.