Fig. 3.
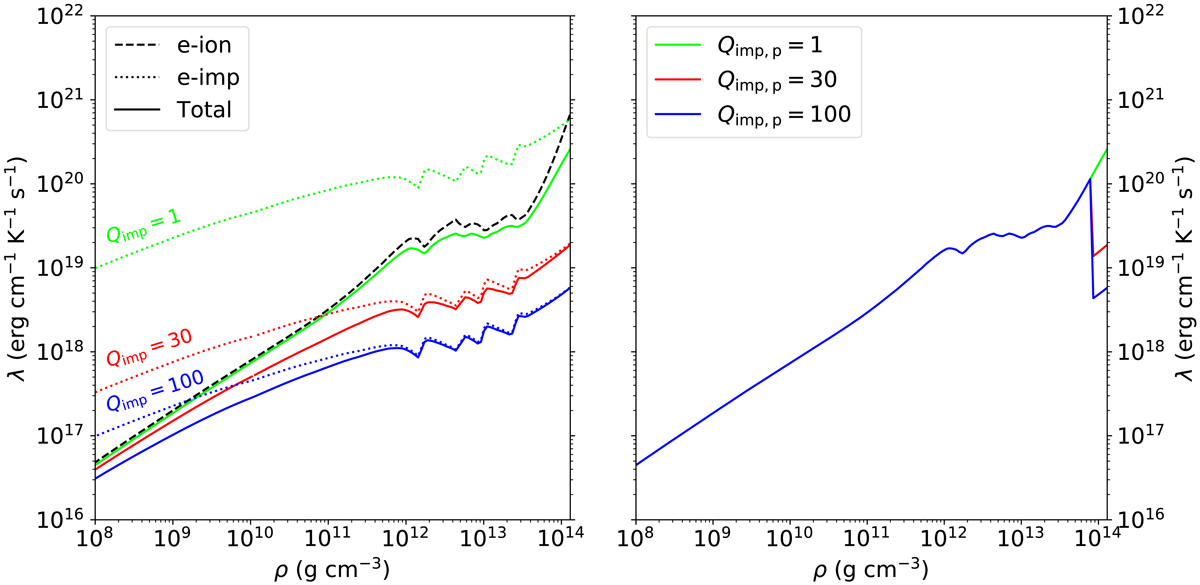
Thermal conductivity in the crust for different models. Left: thermal conductivity in the crust due to electron-ion scattering (black dashed line), and electron-impurity scattering (dotted lines) for three different assumed impurity parameters throughout the crust, at a constant local temperature of T = 108 K. At this temperature matter is crystallised in the whole density range displayed in this figure. The solid curves show the total thermal conductivity for the three models. For the green curves, an impurity factor of one is assumed in the crust (as in model 1). For the red curves, Qimp = 30 is assumed (as in model 16), and for the blue curves the impurity factor is set to Qimp = 100 (as in model 17). The contribution of electron-ion scattering to the total thermal conductivity is constant for the three models as indicated by the dashed black line. The total thermal conductivity consists of the contributions from electron-ion scattering, electron-impurity scattering, and electron-electron scattering, but the contribution of the last process in insignificant here. Right: total thermal conductivity in the crust at a constant local temperature of T = 108 K, for three models that assume different impurity factors for ρ > 8 × 10¹³ g cm−3, representing the pasta layers. For the green model, Qimp, p = 1 is assumed, for the red model, Qimp, p = 30 (as for model 18), and for the blue model, Qimp, p = 100 (as in model 19). In all models Qimp = 1 is assumed at lower densities in the crust.
Current usage metrics show cumulative count of Article Views (full-text article views including HTML views, PDF and ePub downloads, according to the available data) and Abstracts Views on Vision4Press platform.
Data correspond to usage on the plateform after 2015. The current usage metrics is available 48-96 hours after online publication and is updated daily on week days.
Initial download of the metrics may take a while.