Fig. A.9.
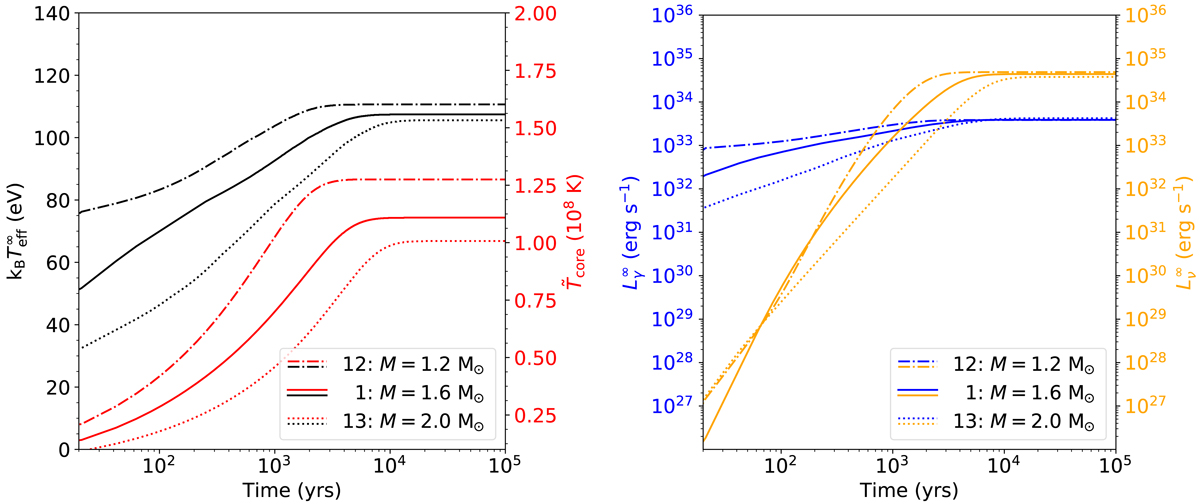
Same as Fig. A.1, but for models assuming different stellar masses (and consequently different radius and compactness, see Table 2). In model 1 (solid curves) we assume M = 1.6 M⊙, a mass of M = 1.2 M⊙ was assumed in model 12 (dashed-dotted curves), and in model 13 we assume M = 2.0 M⊙ (dotted curves). In all models shown here we assume the cooling processes of the minimal cooling paradigm. Due to the changed mass, the neutron stars in these models also have different redshift factors (see Table 2), which is why even though model 13 has the lowest surface temperature, it has the highest photon luminosity when the source has reached its long-term equilibrium state.
Current usage metrics show cumulative count of Article Views (full-text article views including HTML views, PDF and ePub downloads, according to the available data) and Abstracts Views on Vision4Press platform.
Data correspond to usage on the plateform after 2015. The current usage metrics is available 48-96 hours after online publication and is updated daily on week days.
Initial download of the metrics may take a while.