Fig. A.8.
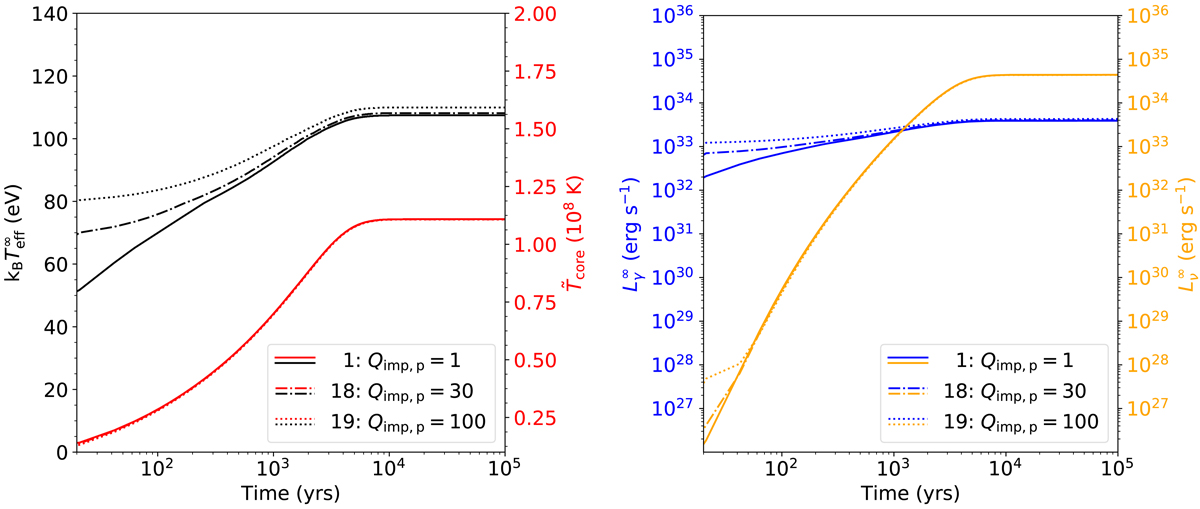
Same as Fig. A.7, but for different thermal conductivity in the pasta region (ρ > 8 × 10¹³ g cm−3). Outside the pasta region, the impurity factor in the crust is Qimp = 1 for all shown models. In model 1 an impurity factor of Qimp, p = 1 (solid curves) is assumed, in model 18 the impurity factor in the pasta region is set to Qimp, p = 30 (dash-dotted curves), and Qimp, p = 100 (dotted curves) is assumed in model 19. A higher impurity factor decreases the thermal conductivity (see Fig. 3).
Current usage metrics show cumulative count of Article Views (full-text article views including HTML views, PDF and ePub downloads, according to the available data) and Abstracts Views on Vision4Press platform.
Data correspond to usage on the plateform after 2015. The current usage metrics is available 48-96 hours after online publication and is updated daily on week days.
Initial download of the metrics may take a while.